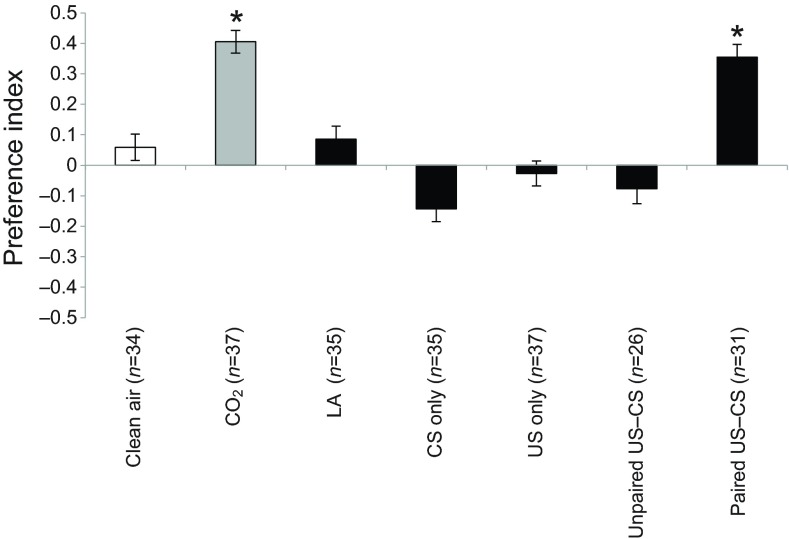
Fig. 3.
Preference of individually trained Aedes aegypti females. Female mosquitoes were individually tested in the olfactometer and given a choice between two stimuli: clean air versus air loaded with either clean air (white bar), CO2 (2300 ppm above ambient level; grey bar) or l-lactic acid (black bars). Preference is represented as the preference index computed from the distribution of insects in the olfactometer, and error bars represent the standard errors of the binary distribution. Each bar represents an experimental group: clean air, neutral control group; CO2, positive control group; LA, l-lactic acid naïve control group; CS only, CS-only group; US only, US-only group; unpaired US–CS, unpaired US–CS group; paired US–CS, appetitive-conditioning group. Asterisks indicate distributions that are significantly different from random (P<0.05).

