Fig. 5.
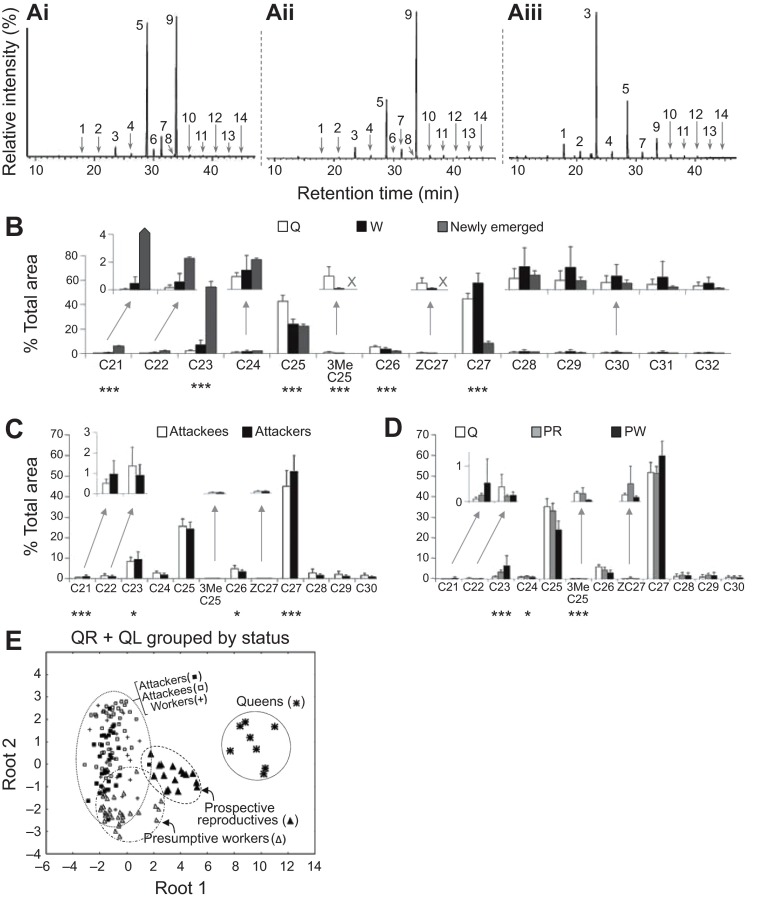
Cuticular hydrocarbon (CHC) profiles of P. micans. (Ai–iii) Chromatogram of P. micans CHCs extracted from a queen (Ai), a worker (Aii) and a newly emerged female (Aiii). For compound numbering and identification, see supplementary material Table S1. (B–D) CHC profile comparison between co-existing types of females under queenright conditions (B) and queenless conditions (C,D) (means ± s.d.). Asterisks indicate the main contributors of separation (discriminant analysis) between types of females (*P<0.05; ***P<0.0001) in log-transformed compound relative proportions. Inset graphs in B–D show compounds present at lower percentages. (B) Queens versus workers from colonies 2–8. The profile of four newly emerged females is shown for comparison but was not included in the statistical analysis because of the small sample size. Compounds that were not detected in the respective female type are marked with a cross. (C) CHC profile comparison between attackees and attackers from colonies 4, 5 and 8. (D) Prospective reproductives (PR) and presumptive workers (PW) from queenless colonies 4 and 5. Queen data from the same colonies are shown for comparison but were not included in the statistical analysis. (E) Discriminant analysis for CHC composition of queenright (QR) females (Queens, Workers), queenless (QL) females 1–3 days after queen removal (Attackees, Attackers) and QL females 7 days after queen removal (Prospective reproductive, Presumptive workers) from colonies 4, 5 and 8. Dotted ellipses encompass all females from a particular group.

