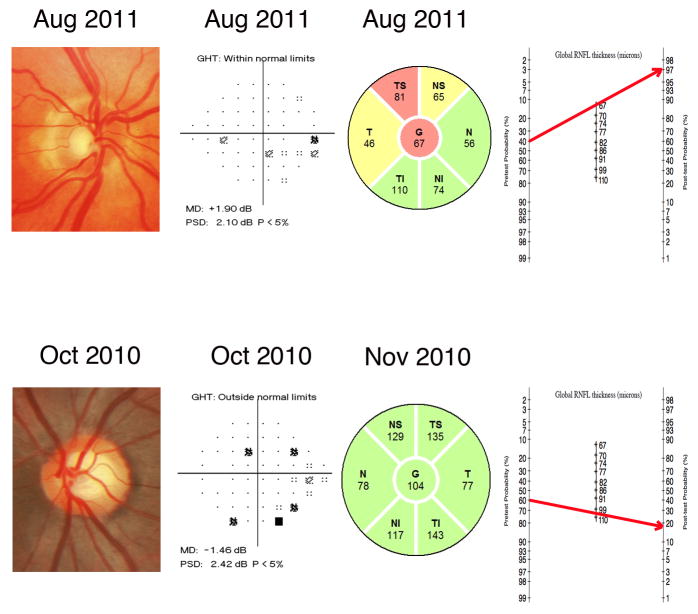
FIGURE 6.
Examples of eyes included in the study illustrating the benefits of incorporating diagnostic likelihood ratios for continuous test results in the diagnostic process. Based on the medical history, clinical examination, intraocular pressure and visual field exam, the eye at the top was considered to have a pretest probability of 40%. The spectral-domain OCT measured a RNFL thickness of 67μm. By applying the modified Fagan nomogram we can see that the post-test probability increased to 97%. Conversely, the eye at the bottom was considered to have a pretest probability of 60%. The spectral-domain OCT measured a RNFL thickness of 104μm. By applying the modified Fagan nomogram the post-test probability decreased considerably to 18%.

