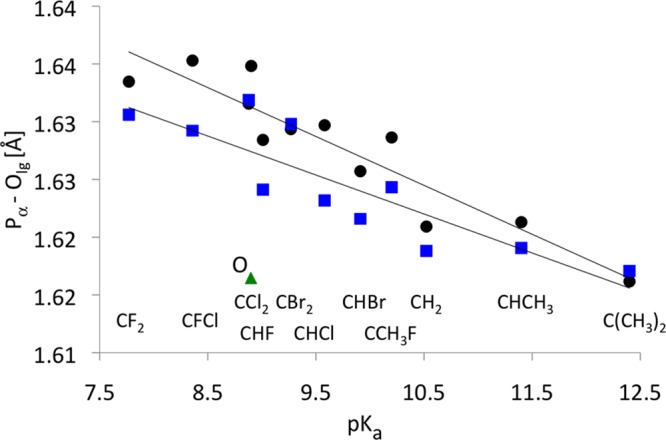
Figure 7.

Calculated Pα–Olg bond length for methyl triphosphate complexes, averaged over two diastereomers (Figure 1), are plotted as a function of the corresponding experimental pKa of PPi and the substituted bisphosphonates.5 The correlation coefficients are R = 0.93 and 0.87 for the doubly protonated (black circle, slope −0.00423) and unprotonated triphosphates (blue square, slope −0.00338), respectively. The green triangle is for the parent O compound in the dianion system that was not included in the linear fit line for unprotonated triphosphates.
