
Figure 3.
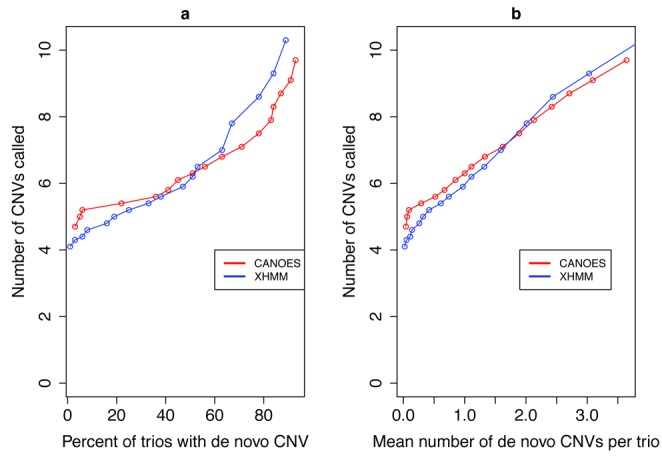
Number of CNVs called versus de novo CNVs. This plot shows, for each of CANOES and XHMM, the relationship between the number of CNVs called and the (a) percentage of trios with a de novo CNV and (b) mean number of de novo CNVs per trio. Moving along each curve from right to left, the quality score increases, and so the number of CNVs called as well as the (a) percentage of trios with a de novo CNV and (b) mean number of de novo CNVs per trio decreases. In the plausible range for the percentage of trios with a de novo CNV, CANOES makes more calls per sample than does XHMM.