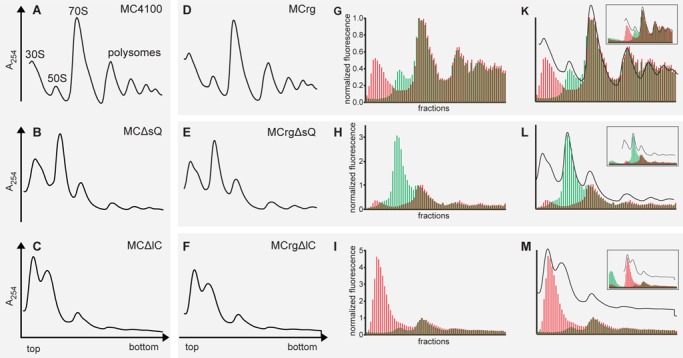
Figure 3.

Polysome analysis and fluorescence detection of sucrose fractions. Cells were grown in M9 medium at 37°C to OD600 = 0.4 and harvested. Lysates were subjected to sucrose gradient centrifugation. Centrifugates were analyzed by A254 detection and fractionated. Polysome profiles derived from (A) MC4100, (B) MCΔsQ, (C) MCΔlC, (D) MCrg, (E) MCrgΔsQ, (F) MCrgΔlC. Sucrose gradient fractions of samples D–F were analyzed for EGFP- and mCherry-specific fluorescence and normalized results are given in bar charts for (G) MCrg, (H), MCrgΔsQ and (I) MCrgΔlC. Superposition of A254 profiles and corresponding fluorescence bar charts: (K) MCrg, (L) MCrgΔsQ, (M) MCrgΔlC. The inserts show fluorescence analysis of all available fractions from each sucrose gradient run. Red bars: normalized mCherry fluorescence; Green bars: normalized EGFP fluorescence. Fluorescence was normalized to 70S peak (‘monosome’) where subunits are supposed to be present in 1:1 ratio. However, the 70S peak contains the tail of the 50S peak, therefore normalization leads to underestimation of the EGFP signal intensity.
