Figure 6.

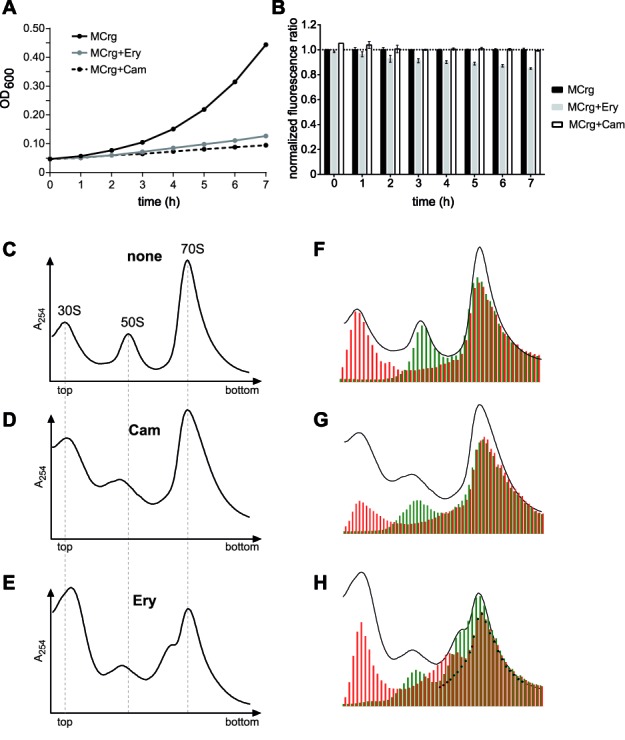
Testing MCrg with inhibitors of translation. Whole-cell analyses: MCrg cells were cultured in Erlenmeyer flasks at 25°C in M9 medium for 7 h in the absence and presence of antibiotics, as indicated. Samples were taken every hour. (A) OD600 values were determined and (B) EGFP and mCherry fluorescence emission were detected and ratios were calculated. Fluorescence ratios of MCrg were normalized to 1. Exemplary growth curves are given and fluorescence ratios are means from three independent experiments; error bars show s.d. Analyses of isolated ribosomal particles: Sucrose density gradient (10–25%) centrifugation profiles from (C) control cells with no antibiotic (none), (D) chloramphenicol (Cam) and (E) erythromycin (Ery) treated cells. Sucrose gradient fractions from (C), (D) and (E) were analyzed for fluorescence by a microplate reader. A254 profiles and fluorescence bar charts were superimposed for (F) control cells with no antibiotic (none), (G) chloramphenicol (Cam) and (H) erythromycin (Ery) treated cells. Cells in presence and absence of antibiotics were cultured in M9 medium at 25°C for 3 h before subsequent polysome analysis. Red bars: normalized mCherry fluorescence; Green bars: normalized EGFP fluorescence. Fluorescence was normalized to the first polysome peak (‘disome’) where subunits are present in 1:1 ratio.
