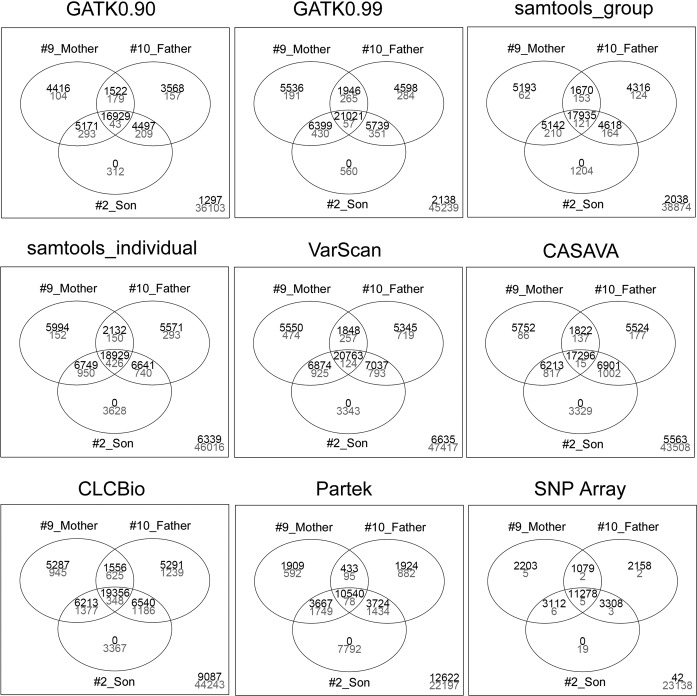
Figure 1.
Distribution of SNP positions across family trio in selected SNP callers. SNPs of family trio composed of samples #9 (mother), #10 (father) and #2 (son) (Supplementary Figure S1), which were generated from GATK0.90 and GATK0.99 (VQSR at 0.90 and 0.99 threshold levels), samtools (call SNPs from samples either as a group or as individuals), VarScan, Partek, CLCBio, Illumina CASAVA and SNP array, were subjected to Venn diagram analysis for their positions. The numbers shown in the overlap indicate shared SNVs between the trio members and those in unique areas indicate unique SNVs for those members. Numbers in black are the number of SNV positions passing MIEC, whereas numbers in gray are the number of SNV positions failing MIEC. Similar results were obtained for the other two trio sets (with sample #3 or # 4 as child) available in the family (data not shown).

