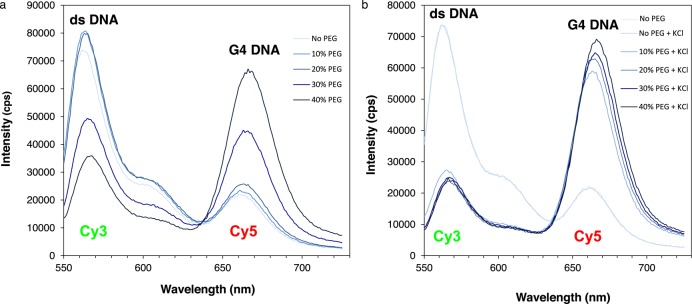
Figure 5.

Effect of PEG concentration on G4 DNA detection in ds c-myc-A12. Emission spectra of ds-myc-A12 prepared by annealing the complementary strands in the presence of PEG 200 concentrations ranging from 0 to 40% in the absence (panel A) or presence (panel B) of 100 mM KCl to induce G4 formation. Spectra are colored such that the shade of blue becomes darker as the PEG concentration increases.
