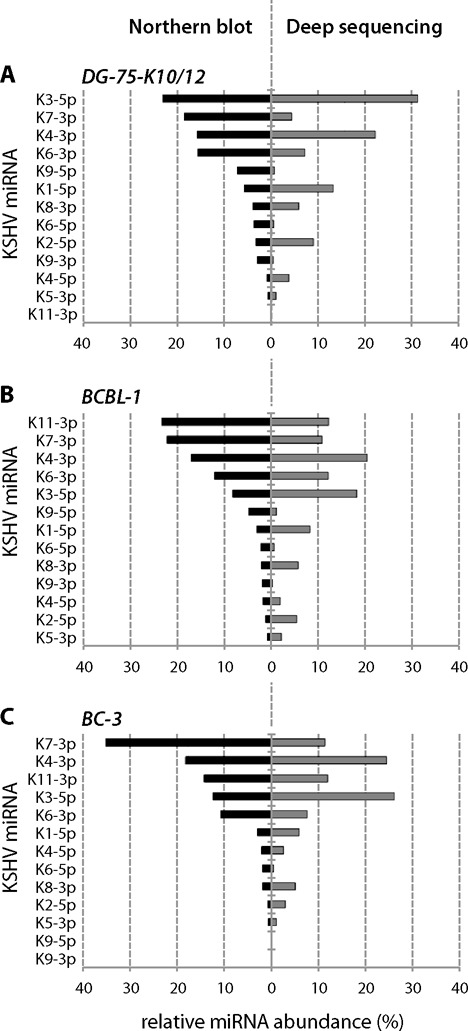
Figure 2.

Relative miRNA abundance. KSHV miRNA abundance is given in percentage and was determined by using the total number of fmol (northern blot) or of reads (deep sequencing) of mature miRNAs as 100%. For each cell line, the miRNAs are ranked from the most to the least expressed according to northern blot analyses.
