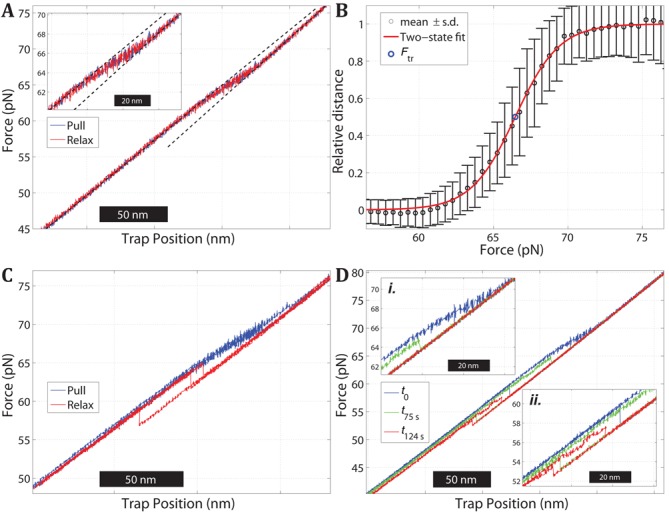
Figure 3.

Stretching of a double-clicked 3′5′AT construct in 1 M NaCl. (A) Plot of force versus trap position during one cycle of pulling (blue) and relaxation (red). The DNA duplex exhibits a continuous transition over a broad force interval (60–70 pN) with no detectable hysteresis between the pulling and relaxation parts of the cycle. Dashed lines show least-mean-square linear fits to the force versus distance data below and above the transition region. (B) Pooled data from nine pull and relax cycles of the molecule in panel (A) showing the relative extension of the duplex versus the applied force. Experimental data (circles with error bars ± 1 s.d.) and fit to a two-state model (red curve) to estimate the force Ftr at the midpoint of the transition (see Supplementary information). (C) Multiple pull and relax trajectories of a 3′5′AT molecule exhibiting hysteresis during the relaxation. Fifteen out of 31 studied 3′5′AT molecules had one or several relaxation curves of this hysteretic type. (D) Pull experiments on a 3′5′AT molecule in the presence of 0.5 M glyoxal (1 M NaCl, pH 7.9) before and after reaction. The blue curve is the pull trace before the DNA was exposed to glyoxal, and shows how the molecule is gradually extended as in panel (A). The molecule was then kept at 74 pN in order to expose the construct to the glyoxal for certain period of time, after which the force was reduced to 20 pN (relaxation curve not shown) and a new pulling experiment was performed to evaluate the effect of the glyoxal. The green and red curves show the pulling of the same molecule after an exposure time of 75 and 124 s, respectively. The transition force is reduced to about 65 pN (green curve in inset i.) and 57 pN (red curve in inset ii.), respectively, indicating the formation of glyoxal adducts.
