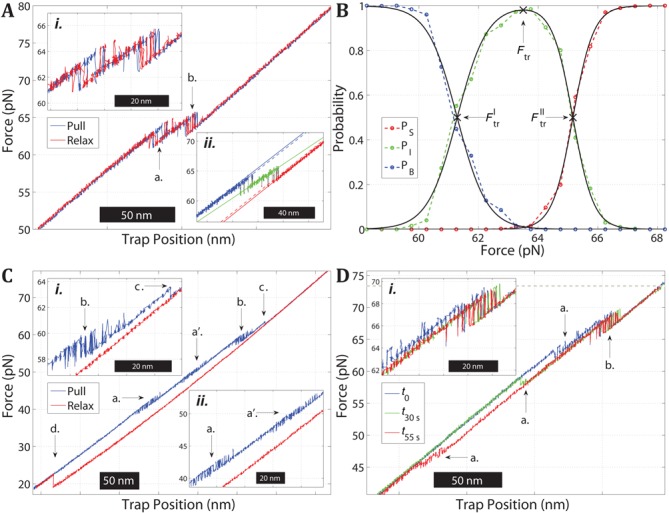
Figure 4.

Force-induced melting and rehybridization of the ATGC construct. (A) Force versus trap position trajectories during multiple pull–relax cycles on an ATGC molecule in 1 M NaCl. The two distinct transitions (a. and b.) are reversible. Inset i. shows that the two transitions are well separated in force and that both exhibit bistability. Inset ii. shows a single pull trajectory for the same molecule and the linear fits (dashed) used to assign the data points to the three states at low (blue), intermediate (green) and high force (red). (B) Population probabilities of the three states as a function of force for the molecule in (A), based on pooled data from the pull and relax trajectories. The fitted curves (black) are used to estimate the transition forces 
 ,
, 
 and
and 
 . (C) Force versus trap position trajectory during a pull–relax cycle on an ATGC molecule in 5 mM NaCl. During pulling (blue), ATGC exhibits four transitions (a.–d.) The first three transitions display bistability (a. and a′. in inset ii, b. in inset i) while the fourth transition is irreversible (c. in inset i). During relaxation (red), the molecule rehybridizes at about 20 pN (d.). (D) Pull trajectories of an ATGC molecule in the presence of 0.5 M glyoxal (1 M NaCl, pH 7.9) before (t0; blue) and after glyoxal reaction for 30 s (t30s; green) and 55 s (t55s; red) while kept in the fully extended state at 74 pN (gray dotted line). The first transition (a.) at about 65 pN (see also a. in panel (A)) occurs at lower forces after glyoxal exposure, at 58 pN after 30 s and at 47 pN after 55 s, respectively.
