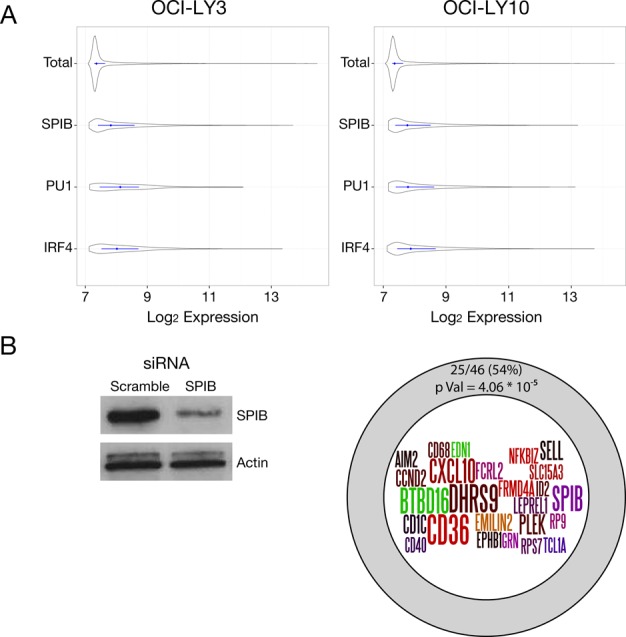
Figure 3.

Gene expression associated with SPIB occupancy. (A) Gene expression values for OCI-LY3 (left panel) and LY10 (right panel) are shown as density plots, with the median and interquartile ranges (25th–75th) shown as a central line for all genes (Total) or genes associated with local factor occupancy (peak ±2kb of TSS) as shown on the y-axis, with log2 expression values on the x-axis. (B) Summary of SPIB knockdown results, representative western blot of SPIB knockdown in OCI-LY3 cells is shown on the left. The intersection of genes showing significant downregulation (adjusted p-value <0.05, >1.5-fold change) following 48 h SPIB knockdown with those also showing local SPIB occupancy (5 kb upstream/intragenic) is illustrated in the diagram on the right.
