
Figure 3.
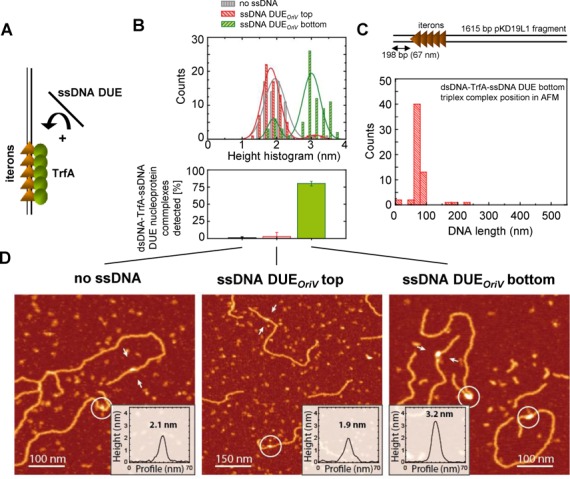
AFM characterisation of TrfA dipartite and tripartite complexes. (A) Scheme of the experiments: TrfA protein was first incubated with linear dsDNA containing iterons and then ssDNA containing the sequence of the top or bottom strand of DUEoriV was added. (B) Top panel: height histogram of TrfA dipartite and tripartite complexes: dsDNA-TrfA (no ssDNA), dsDNA-TrfA-ssDNA top (ssDNA DUEoriV top) and dsDNA-TrfA-ssDNA bottom (ssDNA DUEoriV bottom); bottom panel: occurrence of tripartite complexes. (C) Top panel: depiction of the iterons’ position on the dsDNA substrate; bottom panel, histogram showing the binding position of tripartite complexes on the dsDNA substrate. (D) Typical AFM images of experiments. Characteristic profiles enclosed with white arrows are shown as insets. Other examples of complexes are encircled. Colour scale in AFM images (from dark to white) is 0–2.5 nm.