
Figure 4.
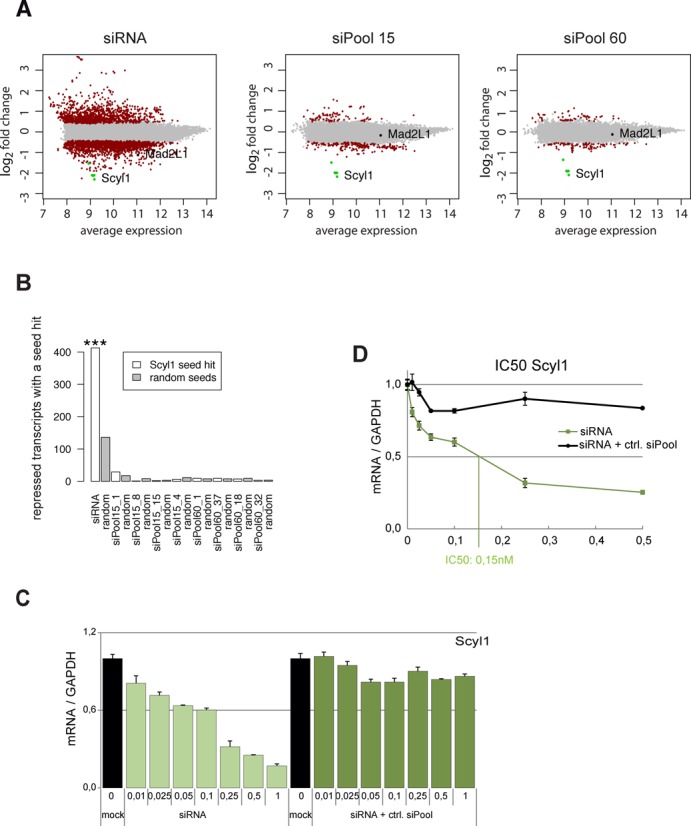
Global mRNA expression profiles upon siRNA transfection. HeLa cells were transfected with 3 nM of a Scyl1-targeting siRNA and siPools. (A) Differential mRNA expression in the single siRNA, pool of 15 sequences and pool of 60 sequences experiment. The horizontal axis shows the average expression level over siRNA-treated and control experiments, and the vertical axis shows the difference in expression between treated and control samples (log2 fold change). Transcripts differentially expressed at a q-value of 10−6 are highlighted in red, and all others are shown in gray. Scyl1 transcripts are highlighted in green, Mad2 (isoform MAD2L1 was targeted) in black. The siRNA experiment induces more genes to change expression levels than the pool experiments. The off-target MAD2L1 is significant differentially expressed in the siRNA experiment, but not in the pool experiments. (B) Enrichment of seed complementary sites in the 3′-UTRs of repressed transcripts. White bars show the number of repressed transcripts with a Scyl1 siRNA complementary seed sequence in the single siRNA (siRNA) and the pool of 15 (pool 15, bar labeled siPool15_1) and 60 sequences (pool 60, bar labeled siPool60_1). Gray bars show the mean number of repressed transcripts in the respective experiment with a complementary site to a random seed sequence. The enrichment in the single siRNA transfection experiment is significant with P << 0.001, while the same sequence as well as three additional randomly chosen sequences of the pools are not significantly enriched in the repressed transcripts. (C and D) Activity of single siRNAs as part of negative control siPools. HeLa cells were transfected with indicated concentrations in nM of Scyl off-T siRNA alone or mixed in an unspecific ctrl. siPool to an equal concentration of individual siRNAs of the siPool. IC50 values are depicted in the line graph (C); in addition, data are also shown in a bar graph (D). mRNA levels were measured via qPCR and normalized to GAPDH.