
Figure 6.
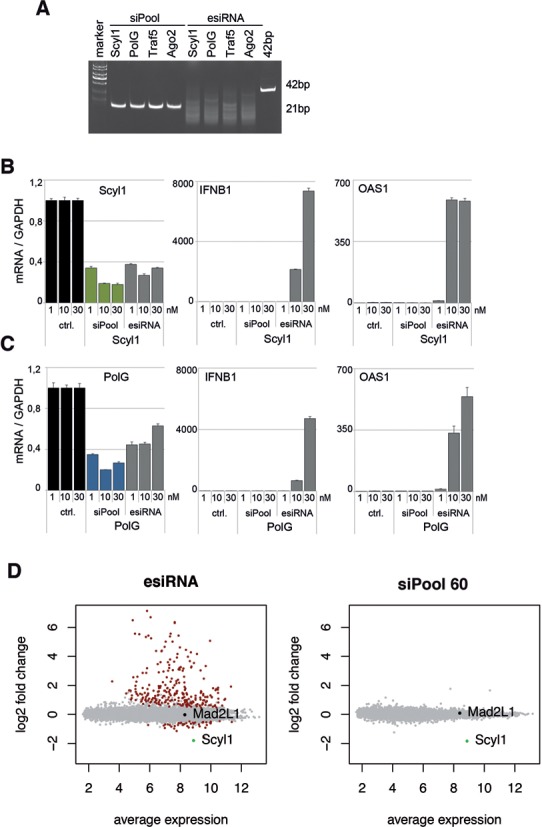
Analysis of interferon response induction. (A) 400 ng of esiRNAs or 200 ng siRNA pools both against Scyl1, PolG, Traf5 and Ago2 were loaded onto a 20% native PAA gel and stained with ethidium bromide. (B and C) MCF7 cells were transfected with 1, 10 or 30 nM siPools or corresponding esiRNAs against Scyl1 (B) or PolG (C). mRNA levels were normalized to GAPDH and relative expression levels were calculated using a negative control siPool. (D) MCF7 cells were transfected with 10 nM esiRNAs (left) or a siPool containing 60 siRNAs (right) against Scyl1. mRNA expression profiles were assessed using microarray.