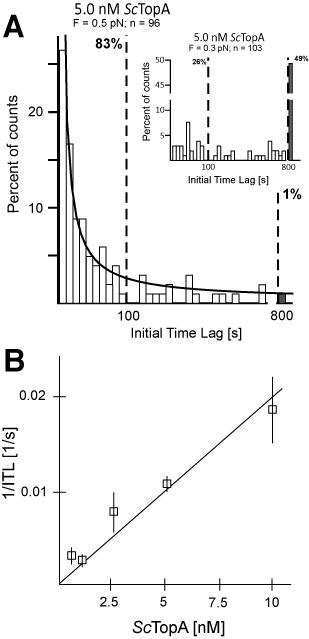
Figure 2.

Force and concentration dependence of the rate at which ScTopA initiates DNA relaxation. (A) The initial time lag (ITL) for ScTopA activity displays a single-exponential distribution and decreases with increasing extending force. Histograms show the distribution of ITL values measured for 5-nM ScTopA and DNA extended by a force F = 0.5 pN (main panel) compared to ITL values measured at low extending force (inset, F = 0.3 pN). The lower extending force resulted in a near abolition of DNA relaxation events and a dramatic elevation of the number of unrelaxed molecules (grey bars in both panels). The number of molecules analysed (n) is shown at the top of each panel. The line corresponds to a single-exponential fit to the data obtained at 5 nM and for which unrelaxed molecules are proportionally very infrequent, giving a mean ITL = 29 s. Dashed vertical bars indicate the fraction of molecules relaxed within 100 s and 800 s, respectively. (B) ScTopA activity initiates more rapidly as concentration increases. The rate of initiation 1/ITL is obtained at each concentration by fitting a single-exponential decay to the cumulative probability distribution of individual ITLs. The cumulative probability distribution allows one to include in the analysis the unrelaxed DNA molecules (which become more frequent at lower concentrations), and by fitting at short timescales the characteristic decay time of the distribution is obtained. For 0.5 nM, n = 43 of which 15 are molecules unrelaxed after 800 s; for 1 nM, n = 39 of which 12 are unrelaxed molecules; for 1 nM, n = 59 of which four are unrelaxed molecules; statistics for 5 nM are given in (A); and for 10 nM, n = 42 of which one is an unrelaxed molecule. Error bars represent SEM obtained from the single-exponential fit.
