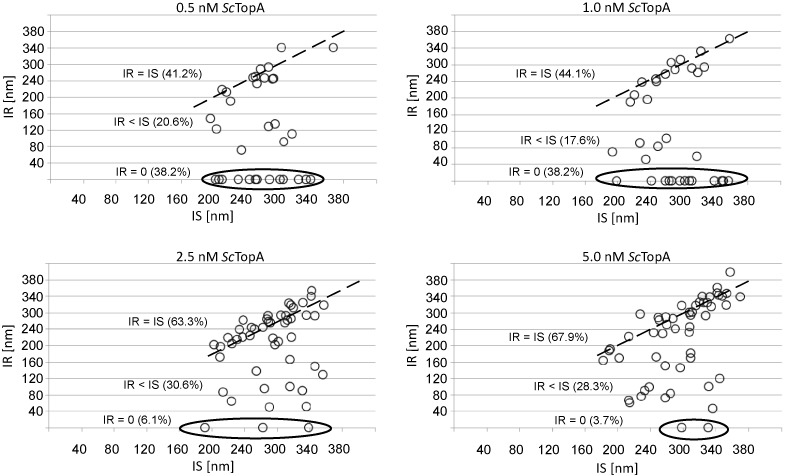
Figure 3.

ScTopA concentrations do not influence enzyme processivity. The enzyme processivity as expressed by the ratio between initial supercoiling (IS) and initial relaxation (IR). Each circle represents a single DNA relaxation event; circles accumulated near the dotted line correspond to nearly full relaxation of supercoiled DNA in single relaxation event (IS = IR), circles marked with a ellipse represent the fraction of DNA molecules remaining supercoiled (IR = 0 within the 800-s recording time); circles located in between correspond to molecules relaxed in more than one burst (IS > IR). Percentage of molecules belonging to each population are shown on each diagram in brackets.
