
Figure 1.
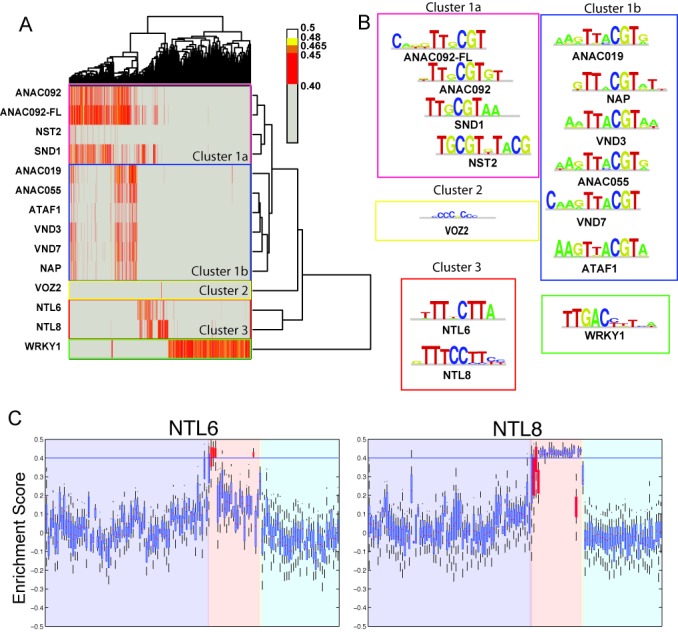
DNA-binding profiles of NAC TFs can be separated into five specificity clusters. (A) Bi-dimensional clustergram of the identified 4821 significant k-mers (X-axis) versus studied TFs (Y-axis). Internal rectangles indicate clusters of TFs showing similar DNA specificity profiles at the k-mer level. (B) DNA specificities for each TF, grouped in clusters as in (A). (C) Enrichment Score distributions for NTL6 and NTL8 shown as boxplots. Dark filled boxes show NTL6 specific k-mer groups. The identity of each k-mer is available in Supplementary Figure S3B. For each box, the central mark represents the median value for the distribution, the box edges represent the 25th and 75th percentiles and the whiskers extend to the last non-outlier data point, as described in Matlab's ‘boxplot’ help documentation (http://www.mathworks.se/help/stats/boxplot.html).