Figure 2.

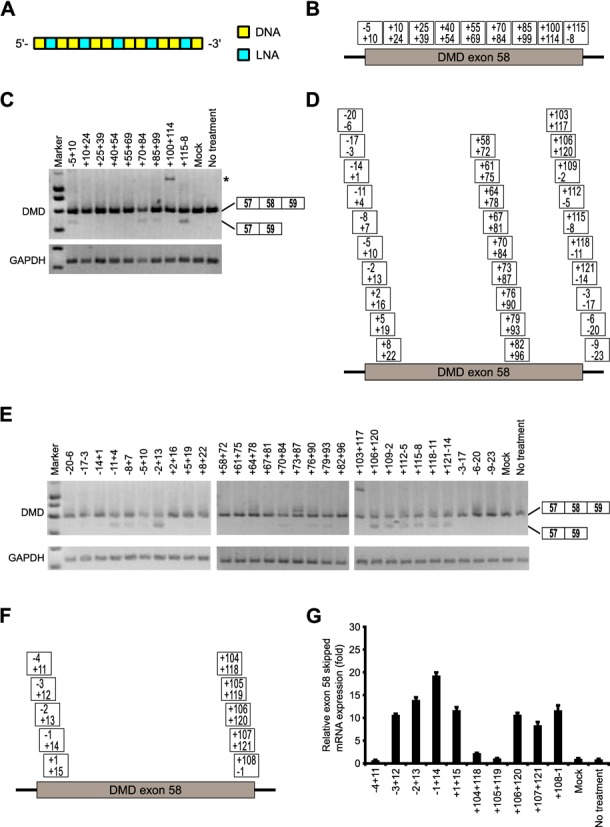
Screening of 15-mer LNA/DNA mixmer SSOs designed to induce dystrophin exon 58 skipping. (A) Schematic representation of the position of LNA in the 15-mer SSO used in this screening. Each box represents one nucleotide; the blue box and yellow box indicate LNA and DNA, respectively. (B, D, F) Annealing sites of SSOs targeted to dystrophin exon 58 are indicated by the boxes for the first (B), second (D) and third screening (F). (C, E) The reporter cells were transfected with the indicated LNA/DNA mixmer SSOs (100 nM) for 24 h. RT-PCR analyses showing the full-length upper band (587 bp) and the skipped lower band (466 bp). The band marked by an asterisk represents an intron 58 inclusion product. GAPDH was used as an internal control. (C) and (E) express the results of the first and second screening, respectively. (G) The levels of exon 58-skipped mRNA fragments were measured by quantitative real-time RT-PCR and normalized against the signal of GAPDH mRNA, relative to the value in the mock set as 1. Values represent the mean ± standard deviation of triplicate samples. Reproducible results were obtained from two independent experiments. Mock: treated with Lipofectamine only; no treatment: no transfection.
