Figure 3.

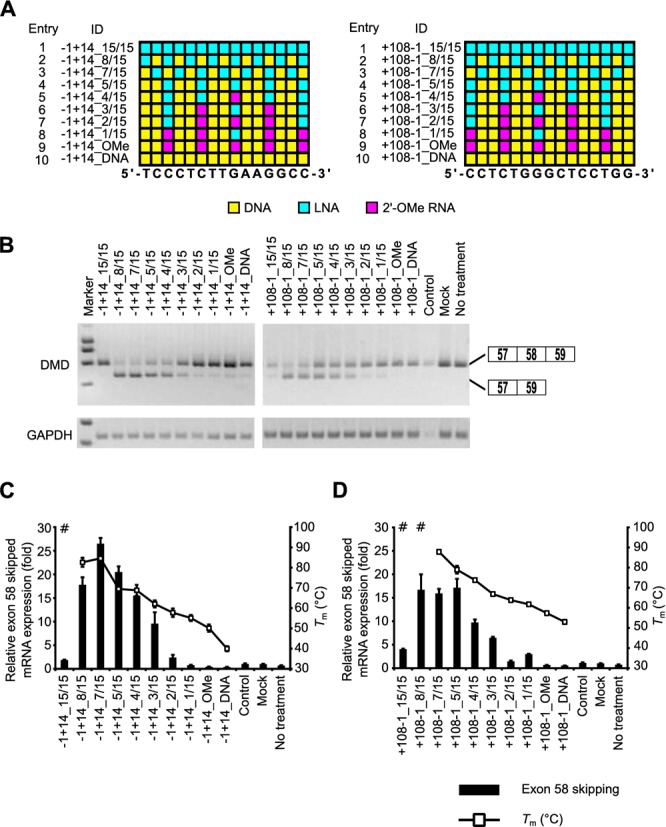
Evaluation of exon skipping activity of 15-mer SSOs with various numbers of LNAs and Tm values. (A) Schematic representation of the position of LNA in the 15-mer SSOs used in this study. Each box represents one nucleotide; the blue box, red box and yellow box indicate LNA, 2' -OMe RNA and DNA, respectively. (B) The reporter cells were transfected with the indicated LNA/DNA mixmer SSOs (30 nM) for 24 h. RT-PCR analyses were performed as described in Figure 2C. LNA SSO (+10+24), which showed no exon skipping effects, was used as a control. (C and D) The levels of exon 58-skipped mRNA fragments were measured by quantitative real-time RT-PCR (for details see Materials and Methods and Figure 2G). Values represent the mean ± standard deviation of triplicate samples. Reproducible results were obtained from two independent experiments. The Tm of each SSO with a complementary RNA under low-sodium conditions is also shown. # indicates that no sigmoidal melting curve was observed, even at higher Tm values. The data are the mean ± standard deviation (n = 4). (C) and (D) express exon skipping results of using SSOs targeted the 5' and 3' splice sites, respectively.
