
Figure 6.
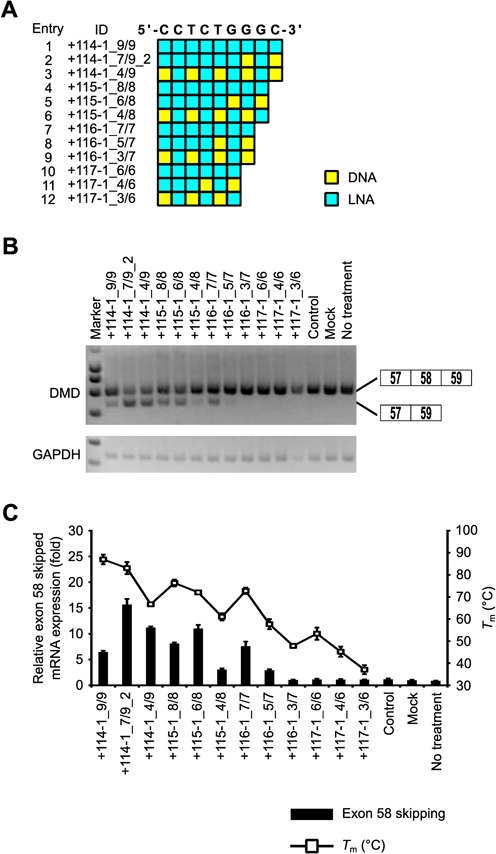
Comparison of exon skipping activity of short (6- to 9-mer) LNA SSOs. (A) Schematic representation of the position of LNA in the SSOs used in this study. (B) The reporter cells were transfected with the indicated LNA/DNA mixmer SSOs (30 nM) for 24 h. RT-PCR analyses were performed as described in Figure 3B. (C) The levels of exon 58-skipped mRNA fragments were measured by quantitative real-time RT-PCR (for details see Materials and Methods and Figure 2G). Values represent the mean ± standard deviation of triplicate samples. Reproducible results were obtained from two independent experiments. The Tm of each SSO with a complementary RNA under low-sodium conditions is also shown. The data are the mean ± standard deviation (n = 3–4).