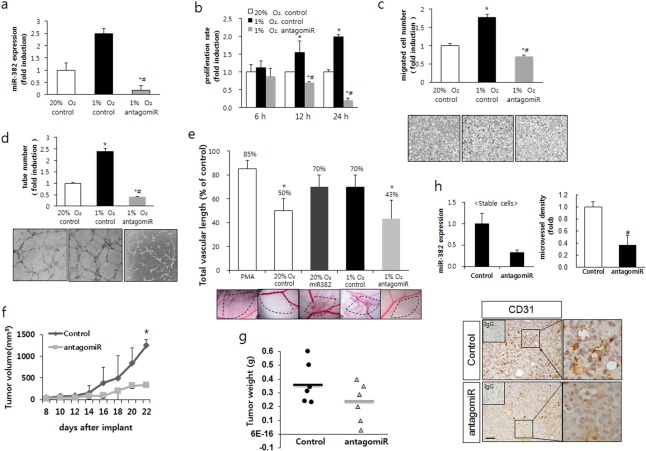
Figure 3.
Inhibition of miR-382 suppressed hypoxia-induced angiogenesis. (a) MKN1 cells were transfected with synthesized antagomir-382 oligomers (70 nM) and the expression of miR-382 was confirmed by real-time RT-PCR. (b) Using conditioned media (CM) collected from the transfected MKN1 cells described in (a), proliferation assays were performed with BAECs exposed to normoxic (20% O2) or hypoxic (1% O2) conditions for 6, 12 or 24 h. (c) Boyden chamber migration assays were performed with BAECs treated with the same CM used in (b). Cells that migrated through the membrane (8 μM pore size) were stained and counted. (d) Tube formation assays were performed using BAECs treated with the CM used in (b). Completed tube numbers were counted and plotted. (e) CM obtained from miR-382 or antagomiR-382 transfected MKN1 cells under normoxic (20% O2) or hypoxic (1% O2) conditions were administered to 6.5-day-chick embryo CAM and new blood vessel formation was observed 4 days later. Eggs showing new vessel formation (positive) are expressed as percentages of the number of eggs tested (noted above the bars). Fifteen eggs were tested per experiment and experiments were performed in triplicate. (f) Xenografted nude mice were injected subcutaneously with MKN1 cells stably expressing control-pEZX or antagomiR-pEZX vector, and observed for 22 days. From one week post-injection, tumor volumes (length × width × height, mm) were measured on alternate days; animals were sacrificed 29 days post-injection. (g) The graph shows tumor weights measured at day 29. (h) Immunohistochemical analysis against CD31 in tumor masses was performed and microvessel density for CD31 positive cells was counted and graphed (right panel). Left panel shows miR-382 expression level in antagomiR-382-stable transfectants. Pictures from IHC were shown in lower panel and magnified images of the boxed regions are shown right each picture. Upper left small box in IHC picture shows IgG control staining. Scale bar = 100 μm. Significance: *P < 0.05 versus the control tumor (or 20% O2 normoxic group) and #P < 0.05 versus the hypoxic control (1% O2).

