Figure 3.

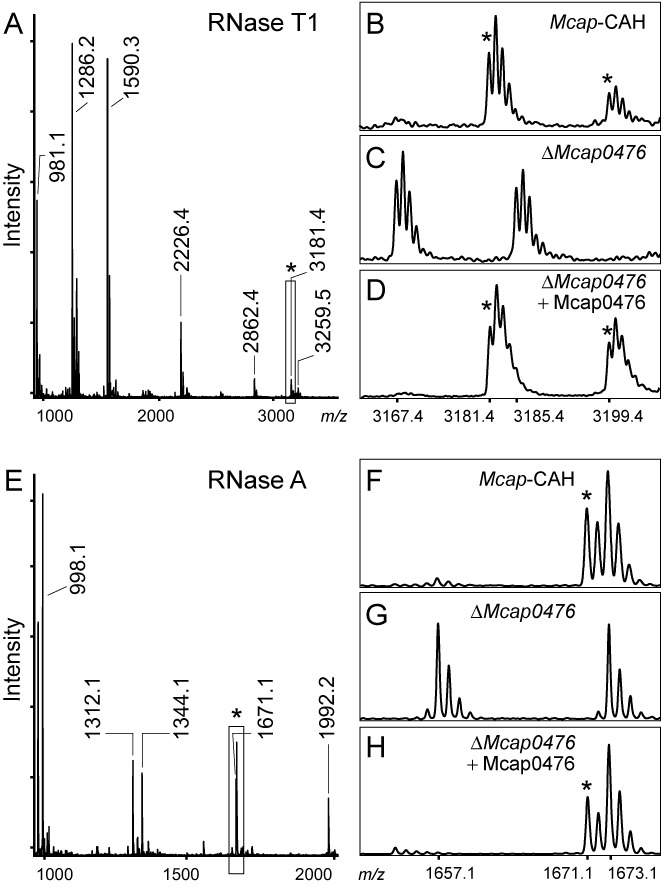
MALDI-MS spectra of the U1939 region from the Mcap strains. Peaks containing m5U1939 are indicated (*). (A) RNase T1 digestion products from the Mcap 23S rRNA sequence G1910-G1964. In the wild-type 23S rRNA from Mcap-CAH, nucleotide U1939 is present in the unique oligonucleotide AAA[m5U]UCCUUG>p with a single methyl group. This oligo (boxed) flies at m/z 3181 with a cyclic 2′,3′-phosphate, and at m/z 3199 with a fully hydrated linear 3′-phosphate. (B) Enlargement of this spectral region for Mcap-CAH and (C) the ΔMcap0476 strain, where reduction in the oligonucleotide mass (m/z 3167 and 3185 with cyclic and linear phosphates) corresponds to the loss of a methyl group. (D) Methylation of the rRNA region was restored after complementation of the ΔMcap0476 strain with an active copy of Mcap0476 expressed from a plasmid. (E) RNase A digestion of the wild-type rRNA where U1939 is in the fragment GAAA[m5U]p at m/z 1671, and can be seen in the enlargement (F) to be adjacent to the unmodified G1930-U1934 peak GGAAUp at m/z 1673 (all fragments with linear 3′-phosphates). (G) In the corresponding spectrum from the ΔMcap0476 rRNA, U1939 lacks a methyl group and flies at m/z 1657, while the m/z 1673 fragment remains unaltered. (H) Transformation of the ΔMcap0476 strain with a plasmid-encoded copy of Mcap0476 restores rRNA methylation. The single ΔMcap0613 knockout strain showed the same methylation pattern as the wild-type strain in panels (B) and (F), whereas the ΔMcap0476/ΔMcap0613 double knockout lacked the U1939 methylation as in panels (C) and (G) (not shown). Other peaks of interest: the RNase A sequence AA[Cm]GGUp at m/z 1992 confirms Cm1920; the RNase T1 sequence AAC[m3Ψ]AUAA[Cm]G>p at m/z 3259 contains m3Ψ1915 and Cm1920; and the RNase T1 sequence ACCCG>p at m/z 1590 shows that C1962 is unmodified. The empirical and theoretical masses match within 0.2 Da; all values are for 12C monoisotopic masses. The multiple tops in the enlargements reflect the natural 12C/13C distribution.
