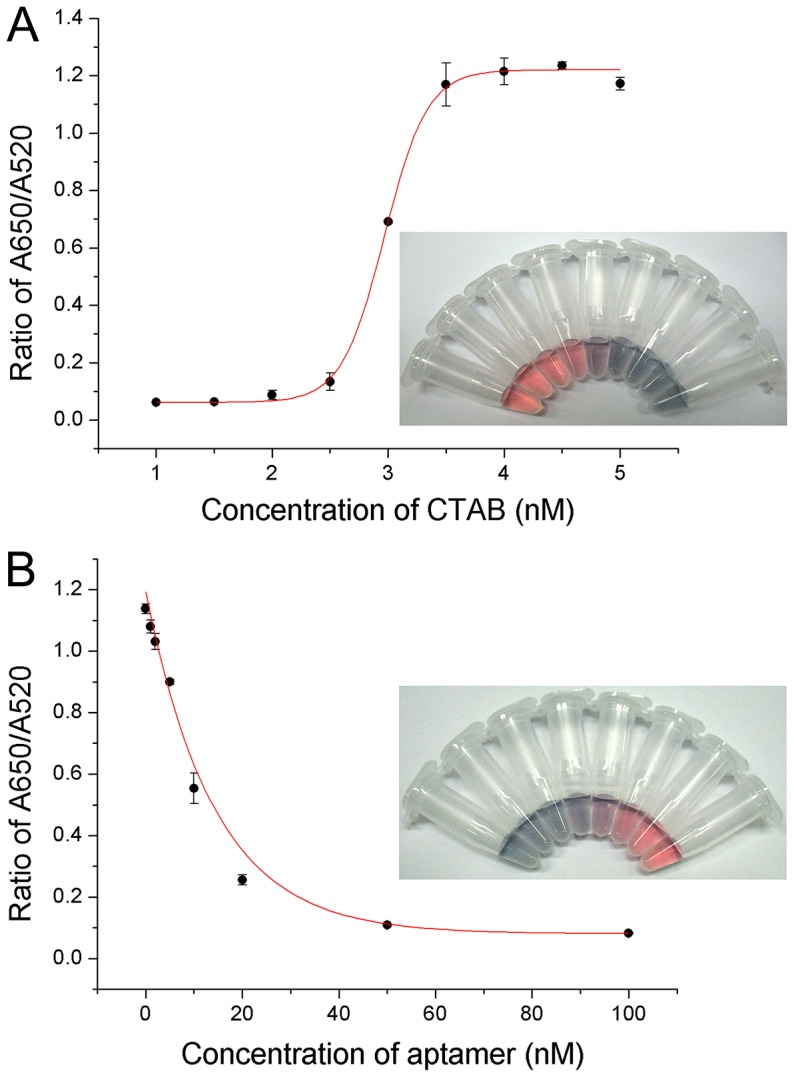
Figure 2. Optimization of CTAB and pL1 aptamer concentrations.

(A) The effect of the concentration of CTAB on pLDH detection. The inset figure represents the visual color change of the AuNPs at each concentration level. (B) The effect of the concentration of the pL1 aptamer on pLDH detection. The inset figure shows the visual color change of the AuNPs at each concentration level. (A and B) Points and error bars represents the means and standard deviations, respectively, of three repeated measurements.
