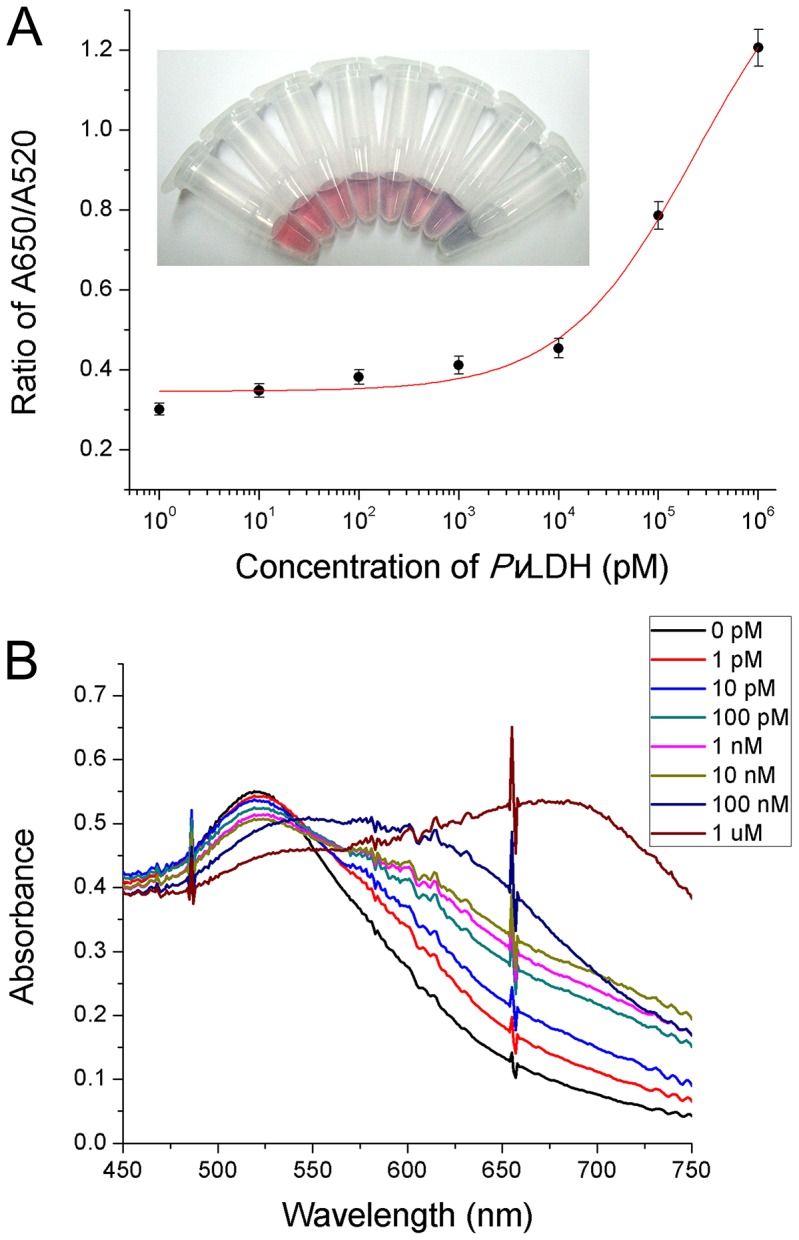
Figure 3. Colorimetric detection of recombinant PvLDH.

(A) The calibration curve of the sensing solutions containing varying concentrations of PvLDH. Points and error bars represents the means and standard deviations, respectively, of three repeated measurements. The inset figures represent the visual color changes of the AuNP solutions. (B) The absorbance spectra for the detection of PvLDH.
