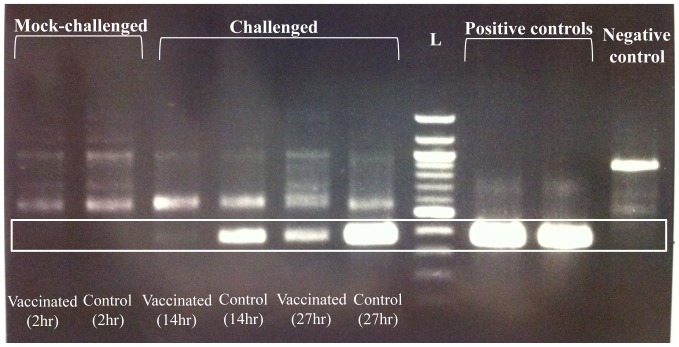
Figure 3. Semi-quantitative PCR detected variable amount of Streptococcus iniae from the water samples holding pathogen-challenged fish.
The boxed region indicates the expected band size from S. iniae specific reaction (373 bp). No S. iniae band could be detected from the two ‘mock challenged’ groups and the negative control. The ‘control challenged’ group at 27 hours post-challenge (hpc) had the most intense band followed by ‘control challenged’ group at 14 hpc, ‘vaccinated challenged’ group at 27 hpc and ‘vaccinated challenged’ group at 14 hpc. The positive controls were from total genomic DNA extracted from brain of infected seabass. The negative controls were E.coli (XL-1 Blue) genomic DNA. L indicates 100 bp DNA ladder (NEB). Brackets indicate hours post challenge (hpc).

