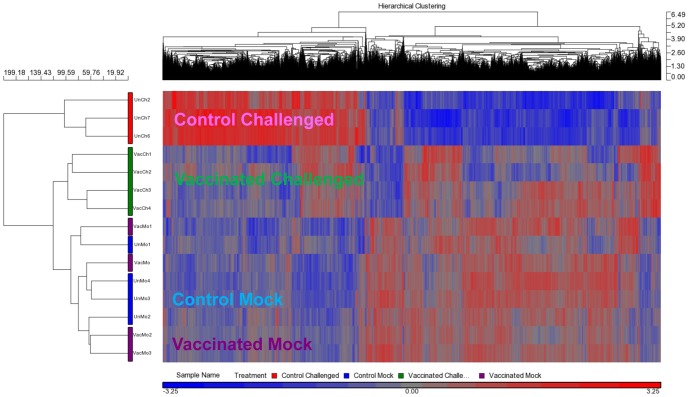
Figure 7. ‘Control challenged’ spleen had greater change in transcriptome profile compared to ‘vaccinated challenged’ spleen.
The transcriptomic profiles of the ‘vaccinated challenged’ spleens at 22 days post-vaccination were more similar to the ‘control mock’ and ‘vaccinated mock’ spleens. The ‘vaccinated challenged’ spleens clustered together with the ‘mock challenged’ ones in the same primary clade, but in their own sub-clade, while the ‘control challenged’ seabass clustered into another major clade. The hierarchical clustering map was generated using 10,331 probes that showed a p-value with FDR (treatment) <0.05 in a one-way Anova analysis.

