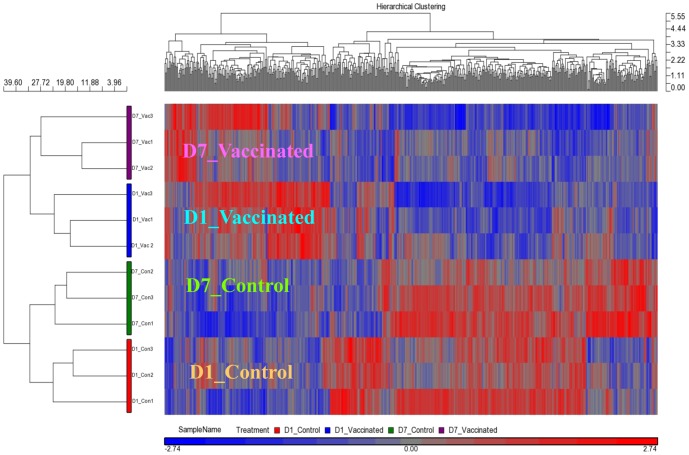
Figure 9. The head kidney samples were separated into two major clades according to the vaccination background.
The head kidneys were then further separated based on the days post-vaccination within each of the two clades. The hierarchical clustering map was generated based on 620 genes with p-value (treatment) (unadjusted p-value) <0.01 in a one-way Anova analysis.

