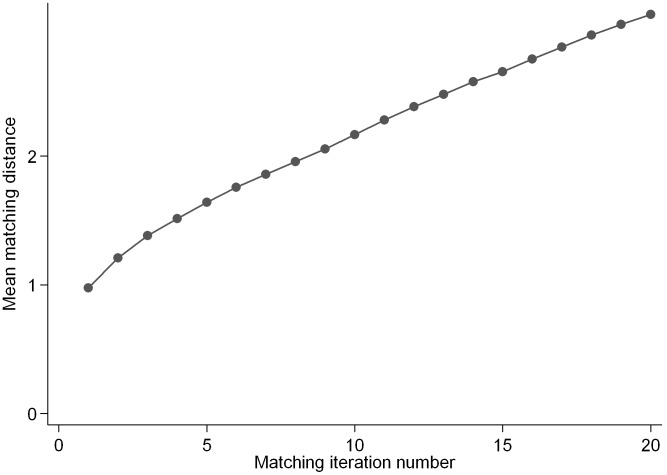
Figure 2. Scree plot.
Mean matching distance across match-variables plotted against matching iteration number (number of observational participants matched with every trial participant). Matching was based on protein E%, carbohydrate E%, glycemic index, body mass index and waist circumference. Example of one of the ten random orders of the trial dataset is shown. E%: percent of energy intake.

