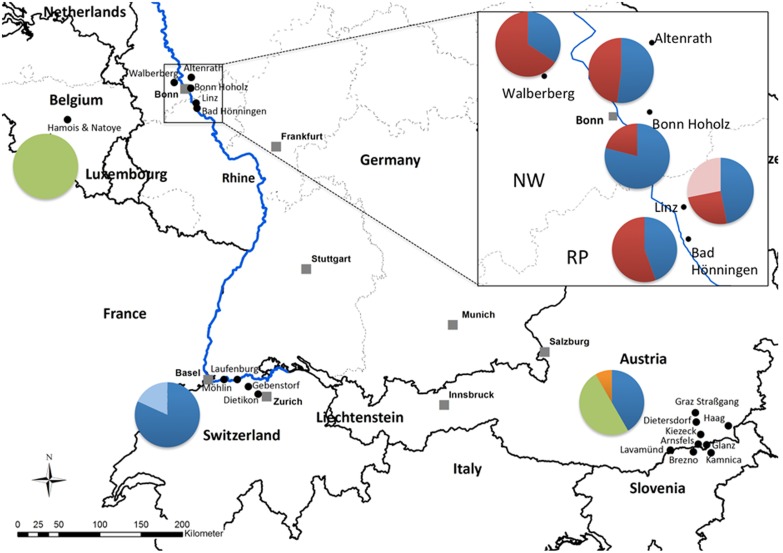
Figure 1. Sampling spots in North Rhine-Westphalia and Rhineland-Palatinate in Germany (box) as well as in Belgium, Switzerland, and Austria/Slovenia.
Pie charts show the relative frequency of the six nad4 mitochondrial DNA haplotypes. NW = North Rhine-Westphalia, RP = Rhineland-Palatinate. Haplotypes: blue = H1, red = H5, pink = H6, green = H9, orange = H10, light blue = H33. The numbers of specimens sequenced at the nad4 locus in each population are listed in Table 1.

