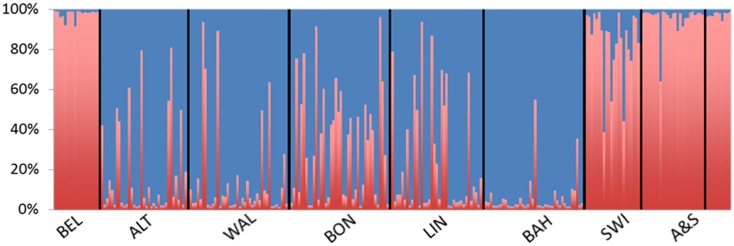
Figure 2. Results of a Bayesian cluster analysis of multilocus microsatellite genotypes.
Each individual included in the analysis is represented by a thin vertical line, partitioned into colored segments that represent the individual’s probability of belonging to one of the two most likely genetic clusters. The origin of each specimen was not used in the analysis. Red = genotype 1, green = genotype 2, BEL = Belgium; ALT = Altenrath; WAL = Walberberg; BON = Bonn-Hoholz; LIN = Linz; BAH = Bad Hönningen; SWI = Switzerland; A&S = Austria/Slovenia. One specimen from Bad Hönningen has a genotype indicating it is likely the result of a cross between genotype 1 and genotype 2 (an F1).

