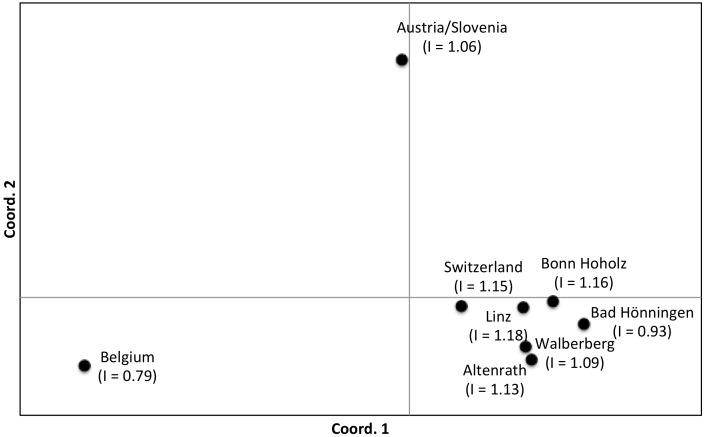
Figure 3. Principal coordinate analysis plot of pairwise F ST genetic distances for the five German populations and samples from Belgium, Switzerland, and Austria/Slovenia.
For sample sizes please refer to Table 1. Values in parentheses are Shannon diversity indices (I). Coordinates 1 and 2 account for 86.6% of the variation.

