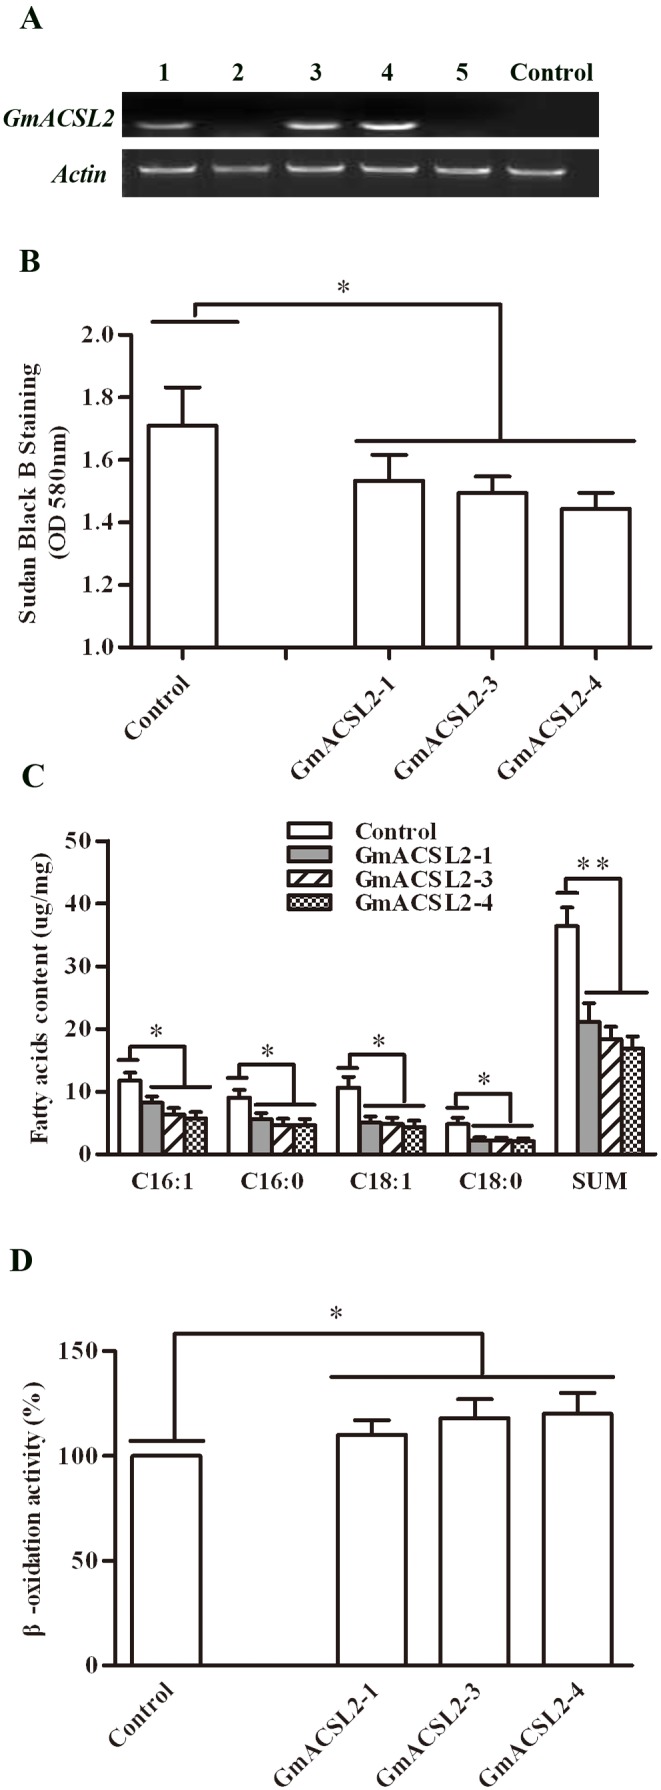
Figure 4. Overexpression of GmACSL2 in yeast pep4.

(A) Expression analysis of GmACSL2 in different transformed lines by RT-PCR. Numbers 1 to 5 represents the five lines, GmACSL2-1, GmACSL2-2, GmACSL2-3, GmACSL2-4, and GmACSL2-5, transformed with pYES2-GmACSL2. The actin gene was used as the control for equal gel loading. Control represents the line transformed with pYES2 empty vector. (B) Sudan black B staining. The cells of three transformed lines GmACSL2-1, GmACSL2-3, and GmACSL2-4 were stained with Sudan Black B. The absorbance was measured at 580 nm and the line transformed with pYES2 vectors as control. (C) Fatty acids analysis comparisons between three transformed lines GmACSL2-1, GmACSL2-3 and GmACSL2-4 and the control line. The four major fatty acid species C16∶0, C16∶1, C18∶0, C18∶1 and the total fatty acids content in the yeast were detected by gas chromatography-mass spectrometry. (D) β-oxidation assay comparisons between three transformed lines GmACSL2-1, GmACSL2-3 and GmACSL2-4 and the control line. Oleate β-oxidation measurements in cells were followed by quantification of [14C] CO2 and 14C-labelled β-oxidation products in a liquid scintillation counter. The β-oxidation activity in control cells in each experiment was taken as reference (100%). Data are presented as the mean ± SEM of the three experiments. *p<0.05, **p<0.01.
