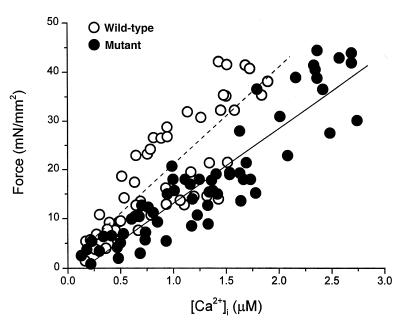
Figure 3.
Pooled data of peak force and peak systolic [Ca2+]i from wild-type (closed circles) and mutant (open circles) muscles. Varied levels of force were obtained at different [Ca2+]o (1.0–10.0 mM). Note the different populations of data points between the two groups, with similar slopes when fitted by a linear function. The mean slopes of the two groups were not different: 18 ± 3 [Ca2+]i in wild-type vs. 14 ± 2 [Ca2+]i in mutant; P = 0.2.

