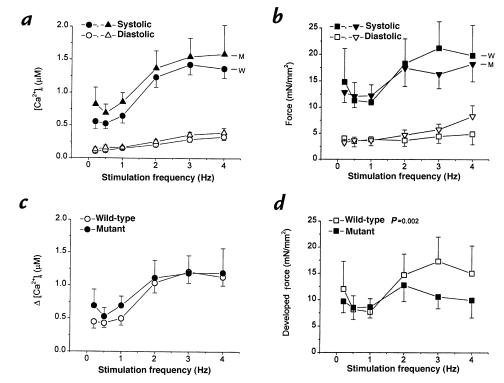
Figure 5.
Force–frequency relationship of mouse cardiac muscle. Pooled data of [Ca2+]i (a and c) and twitch force (b and d) from wild-type (circles and squares; n = 6) and mutant (triangles; n = 7) muscles are plotted at varied stimulation frequencies at [Ca2+]o = 2.0 mM. (a and b) Systolic and diastolic [Ca2+]i and force. Note the increases in both twitch force and [Ca2+]i in wild-type muscles when stimulation frequency increased. In mutant muscles, increases in force was blunted at higher stimulation rate, with elevation of diastolic force. (c and d) Changes of [Ca2+]i and developed force as stimulation rate was increased. Note the decrease in developed force in mutant muscles at higher stimulation rates. The two response curves are statistically different (P < 0.002) by multivariate ANOVA.

