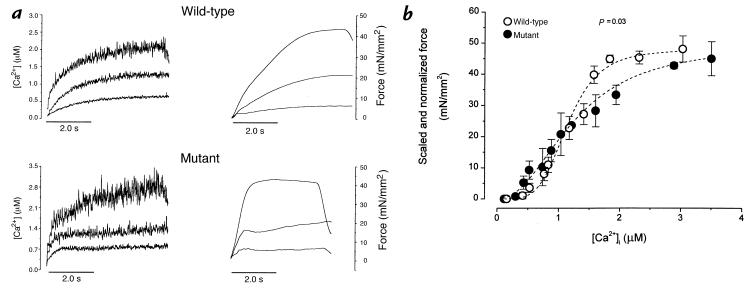
Figure 6.
Steady-state force–[Ca2+]i relationship of mouse cardiac muscle. (a) Recordings of [Ca2+]i (left) and force (right) at different levels of activation from one muscle in each group. Tetanizations were achieved by stimulating the muscle at 10 Hz in the presence of cyclopiazonic acid (50 mM) at varied [Ca2+]o to obtain different levels of tetanization. (b) Pooled data for steady-state force–[Ca2+] relationships of wild-type (open circles; n = 5) and mutant (closed circles; n = 8) muscles. Data were grouped in various bins of [Ca2+]i. The absolute Fmax are shown as means ± SEM and are plotted at highest [Ca2+]i. All other force levels were normalized with respect to their own maximal values. The dashed lines are the Hill fits , based on the means of Ca50 and Hill coefficient in each group. In mutant muscles, there is a less-steep force–[Ca2+]i relationship, which also crosses over that of the wild-type at ∼Ca50. P < 0.03 by multivariate ANOVA. Ca50, [Ca2+]i required for 50% of maximal activation; Fmax, maximal Ca2+-activated force.

