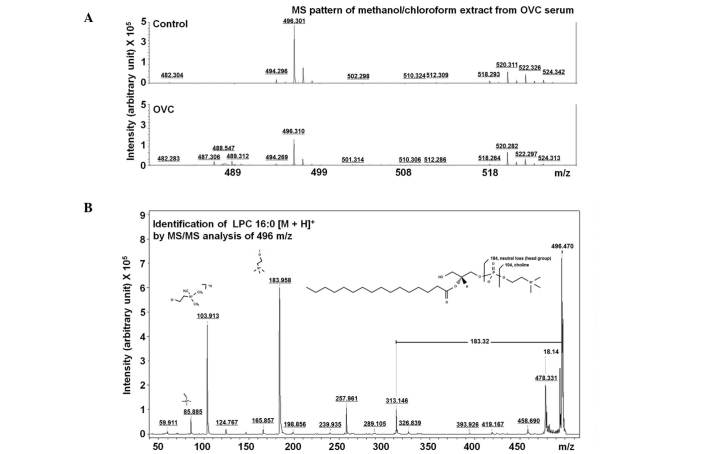
Figure 3.
Identification of LMIs with 496.30 m/z. (A) Mass peak pattern of an LMI with 496.30 m/z on mass spectra. (B) MS/MS analysis for the identification of an LMI with 496.30 m/z. The MS/MS spectrum of the LMI with 496.30 m/z was identical to that of LPC (16:0). LMI, low-mass ion; MS/MS, tandem mass spectrometry; LPC, lysophosphatidylcholine; OVC, ovarian cancer.

