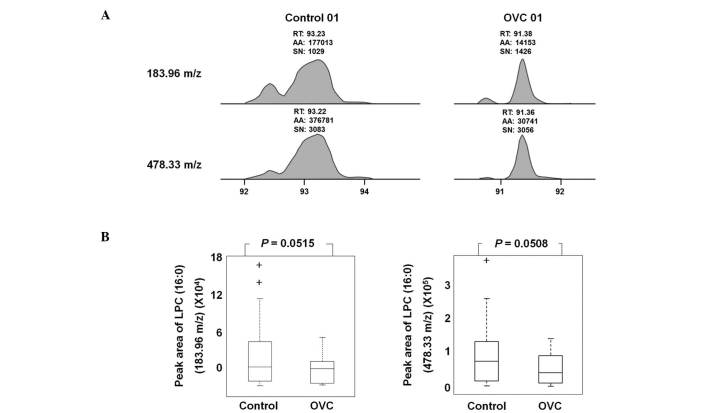
Figure 5.
Decreased level of LPC (16:0) in the sera of patients with OVC. The level of LPC (16:0) was assessed through integrating the appropriate peaks for LPC, followed by calculating the ratio of the peak areas. (A) Extracted ion chromatogram of LPC (16:0) in the sera of the control participants and the patients with OVC. Peak areas at 183.96 and 478.33 m/z indicated the concentration of LPC (16:0). (B) The peak area of LPC (16:0) at 183.96 and 478.33 m/z. The peak area of LPC (16:0) with either 183.96 or 478.33 m/z was decreased in the sera of the patients with OVC compared with the controls, but was not significantly different (P=0.0515 and P=0.0508, respectively). LPC, lysophosphatidylcholine; OVC, ovarian cancer; RT, retention time; AA, peak area counts; SN: signal-to-noise ratio.

