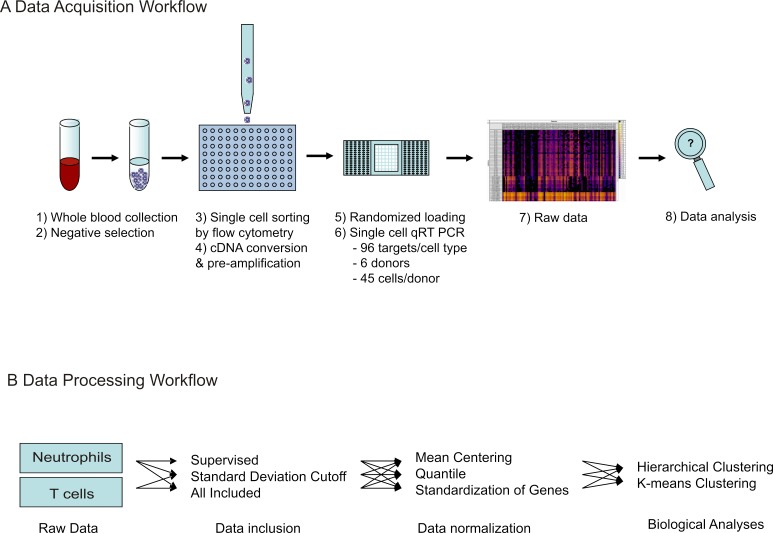
Figure 1. Workflow of single cell transcriptional data acquisition.
(A) Whole blood was collected from healthy donors, and negative selection used to isolate T cell and neutrophil populations. Single cell sorting was then used to deposit one cell per well into 96-well plates, pre-loaded with lysis buffer. Following this, cDNA conversion and pre-amplification was done in plate, and resulting cDNA samples randomly loaded onto microfluidic arrays. qRT-PCR reactions were run simultaneously against 96 gene targets per cell. Raw data was obtained as Ct values. (B) For data processing, three methods were tested for data inclusion in combination with three methods for data normalization. Following this, the resulting nine data sets were analyzed for biological information by gene expression pattern analysis, detection of cellular subtypes by hierarchical clustering, and comparison of individual donor subtype representation.

