Figure 3.
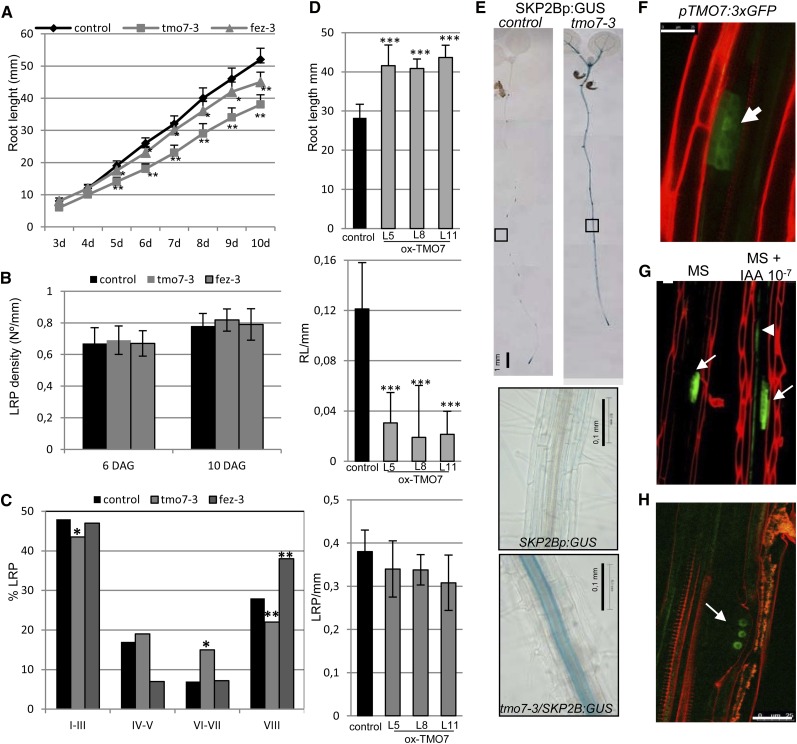
TMO7 and FEZ function in LR emergence. A, Root length of control and tmo7-3 and fez-3 seedlings at the indicated days. *P < 0.05, **P > 0.01 by two-sided Student’s t test (n ≥ 20). Error bars represent se. B, LRP density at 6 or 10 d after germination of control, tmo7-3, and fez-3 seedlings (n = 10). C, Percentage of LRPs at different developmental stages of 8-d-old control, tmo7-3, and fez-3 seedlings. Statistical differences between groups were analyzed by a mixed-model ANOVA: *P < 0.05, ** P > 0.01 (n = 10). D, Root length and number of emerged LRs (eLR) and LRPs per 1-mm of 7-d-old control seedlings and three independent lines of 35S:TMO7. ***P < 0.0001 by two-sided Student’s t test (n ≥ 25). Error bars represent se. E, GUS staining of 7-d-old SKP2Bp:GUS and tmo7-3/SKP2Bp:GUS seedlings. The lowest images show higher magnifications of root sections with GUS staining in the pericycle layer in the tmo7-3 mutant. Bars = 1 mm. F, Confocal image of an LRP expressing pTMO7:3xGFP. Bar = 25 µm. G, Representative confocal images of pTMO7:3xGFP roots treated with or without auxin (10−7 m IAA) for 6 h. Bar = 20 µm. Arrows indicate GFP signal in LRPs, and the arrowhead points to TMO7 induction upon auxin treatment. H, FEZ is expressed in early stages of LRP development. The confocal image shows LRPs of an 8-d-old pFEZ:FEZ-GFP seedling. The arrow points to the FEZ-GFP protein in the nucleus of a developing LRP cell. Bar = 25 µm.

