Figure 5.
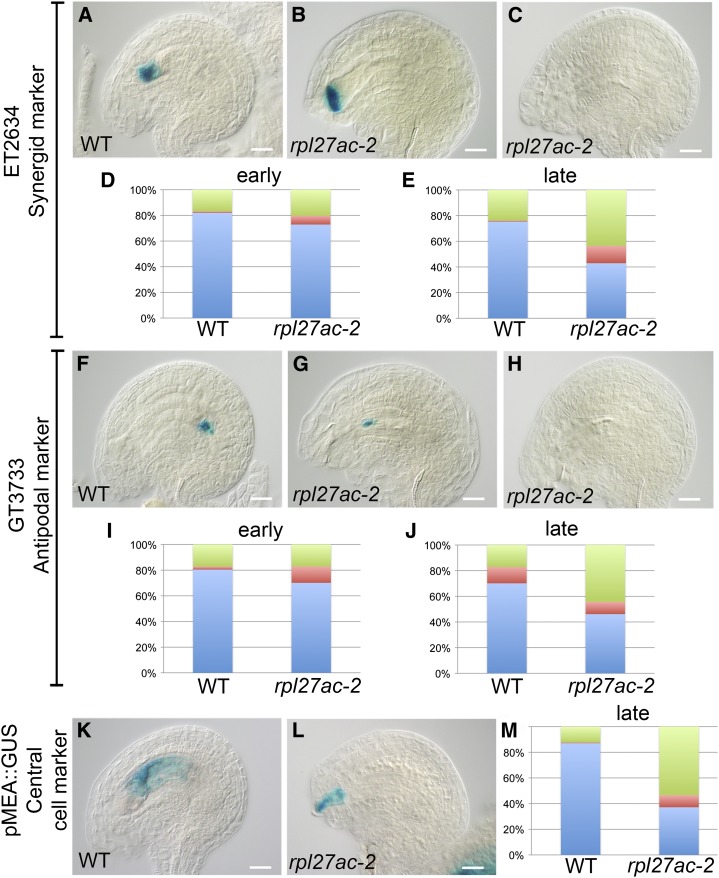
Maturing female gametophytes are expelled from the ovule in rpl27ac-2. A to C, Synergid marker ET2634 expression pattern in wild-type (WT) ovule (A) and abnormal rpl27ac-2 ovules (B and C). D and E, Percentage of wild-type synergid marker expression pattern (blue), abnormal expression pattern (red), and no expression (green) in ovules at early-stage (wild type, n = 176; rpl27ac-2, n = 175; D) and late-stage (wild type, n = 823; rpl27ac-2, n = 850; E) development following cell specification. F to H, Antipodal marker GT3733 expression pattern in wild-type ovule (F) and abnormal rpl27ac-2 ovules (G and H). I and J, Percentage of wild-type antipodal marker expression pattern (blue), abnormal expression pattern (red), and no expression (green) in ovules at early-stage (wild type, n = 170; rpl27ac-2, n = 158; I) and late-stage (wild type, n = 854; rpl27ac-2, n = 892; J) development following cell specification. K and L, Central cell marker pMEA:GUS expression pattern in wild-type ovule (K) and abnormal rpl27ac-2 ovule (L). M, Percentage of wild-type pMEA:GUS expression pattern (blue), abnormal expression pattern (red), and no expression (green) in ovules at late-stage development (wild type, n = 192; rpl27ac-2, n = 520). Bars = 10 µm.

