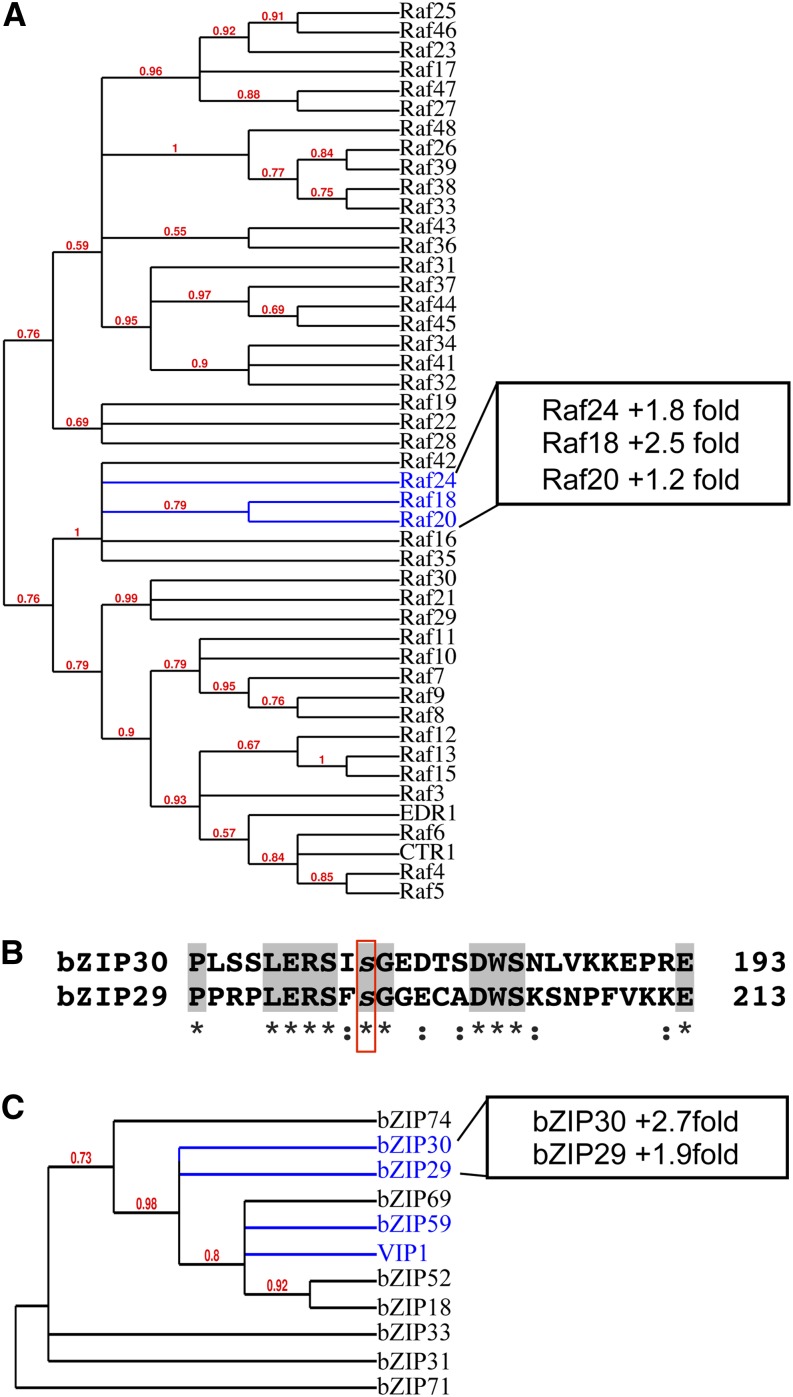
Figure 2.
Coordinate regulation of related gene family members. A, MAPKKK RAF family phylogenetic tree. RAF proteins showing osmotic stress-induced phosphorylation increases are highlighted in blue. B, Alignment of bZIP29 and bZIP30 protein sequences using Clustal Omega. The conserved phosphorylation site is highlighted in the red box. Gray highlights and asterisks indicate identical residues, and colons indicate highly similar residues. C, Phylogenetic tree of bZIP group I family members. Proteins showing osmotic stress-induced phosphorylation and proteins previously implicated in salt and osmotic stress are highlighted in blue. For A and C, trees were made from protein sequence alignment using Phylogeny.fr (Dereeper et al., 2008).

