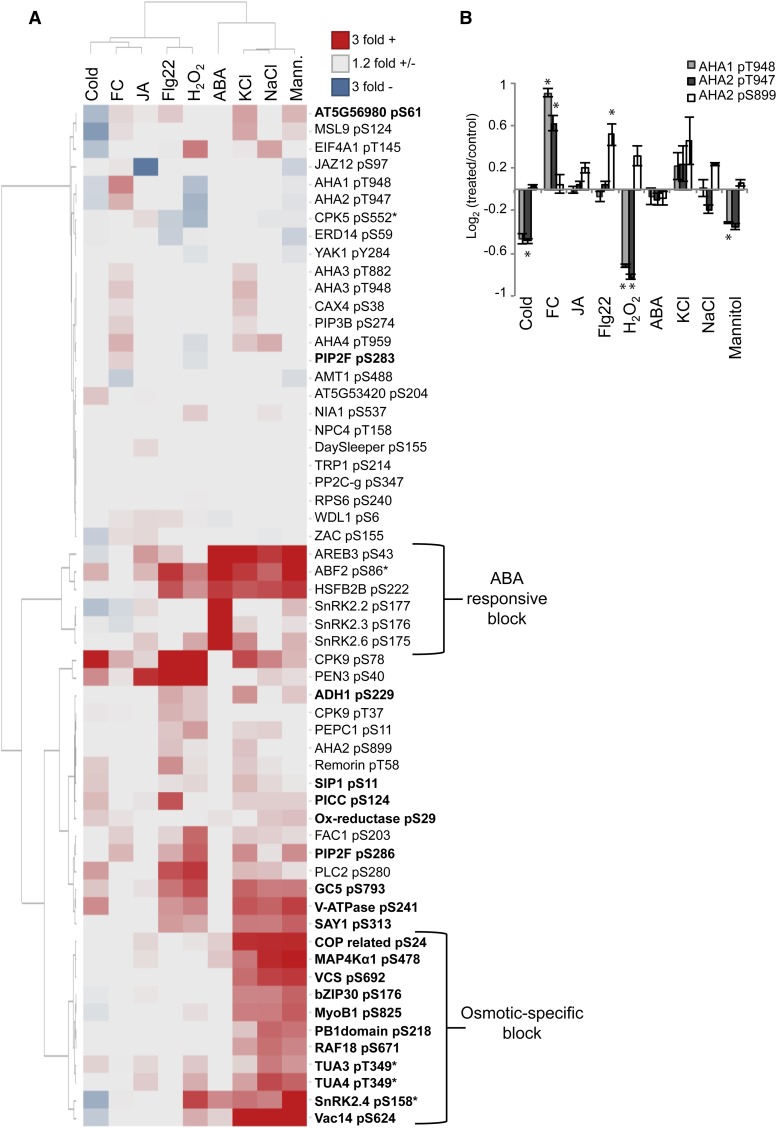
Figure 6.
Hierarchical clustering of targeted phosphoproteomic data. A, Heat map of 58 phosphopeptides measured using SRM. Values represent log2 area ratios of treatment versus control averages. Averages represent three biological replicates per treatment with two or more injection replicates per sample. Data for the heat map are found in Supplemental Table S4. Asterisks indicate nonunique peptides that match multiple gene family members. Phosphopeptides in boldface were selected from mannitol-untargeted proteomic data (Table I). Clustering was performed using the method by Ward (1963). B, AHA1 and AHA2 phosphorylation across all treatments. Error bars represent se for three biological replicates. Asterisks indicate phosphorylation changes with P < 0.05 (Student’s t test). FC, Fusicoccin; JA, methyl jasmonate.

