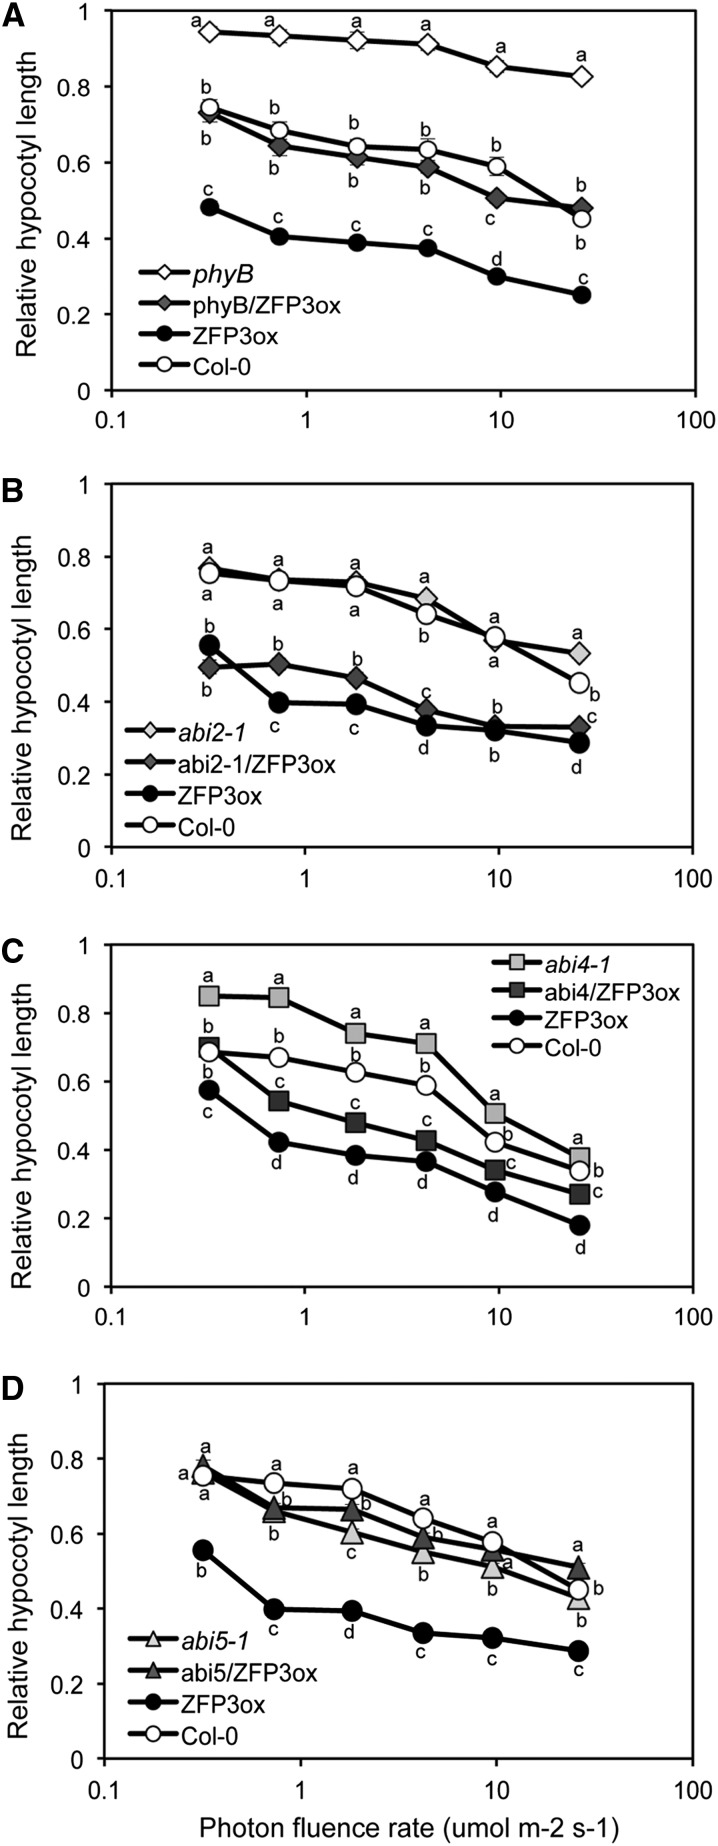
Figure 8.
Genetic interaction of ZFP3 with PhyB and ABA signaling components. Relative hypocotyl lengths of seedlings with the indicated genotypes are shown at different fluence rates of red light in the presence of 4 μm estradiol. Hypocotyl lengths were normalized to the corresponding dark-grown seedlings. The x axes show a logarithmic scale. Statistical tests were performed by one-way ANOVA and Tukey’s test independently for each fluence rate, and different letters show significant differences at P < 0.05.

