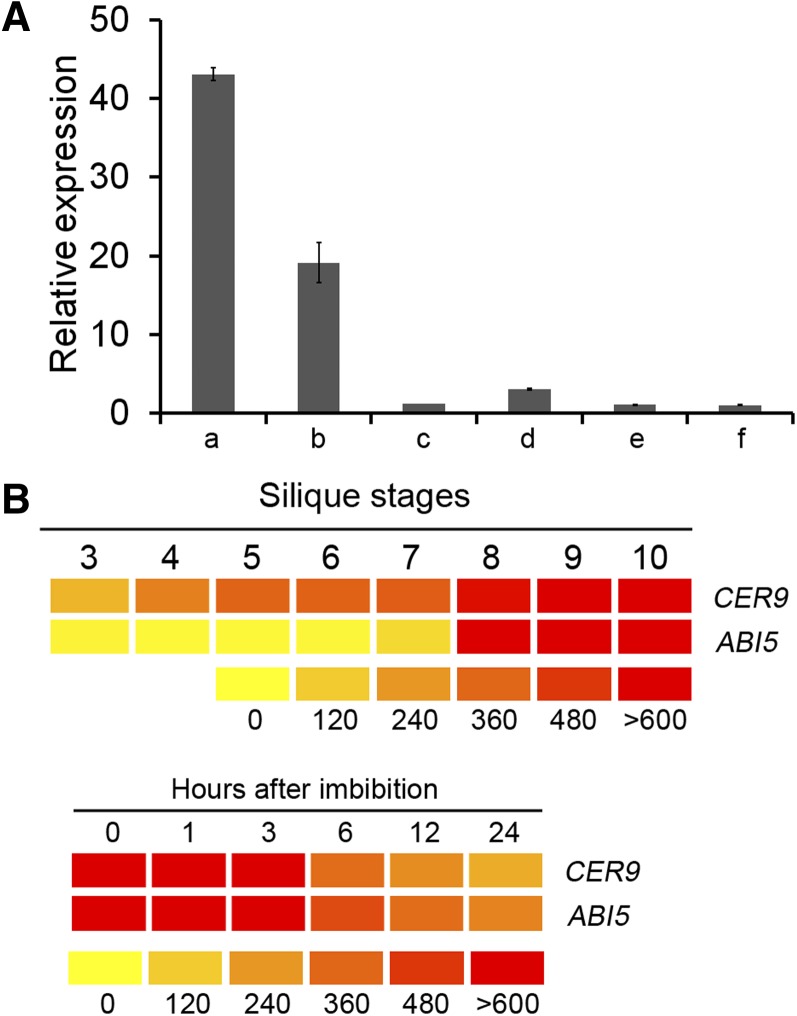
Figure 3.
Transcript abundance of CER9 and ABI5 during various developmental time periods. A, Real-time PCR analysis of CER9 in dry seeds (a) and seeds at the end of 3 d of stratification (b), seeds incubated on 1/2 MS medium for 1 d (c) or 3 d (e), or seeds incubated on 1/2 MS medium containing 1 µm ABA for 1 d (d) or 3 d (f) at 22°C after stratification. B, Expression of CER9 and ABI5 during seed maturation and imbibition. Public microarray data were processed using BAR HeatMapper (http://bar.utoronto.ca/ntools/cgi-bin/ntools_heatmapper.cgi) to visualize gene expression patterns. Higher expression is indicated by more reddish color. Numbers indicate the relative expression levels of the mRNAs.

