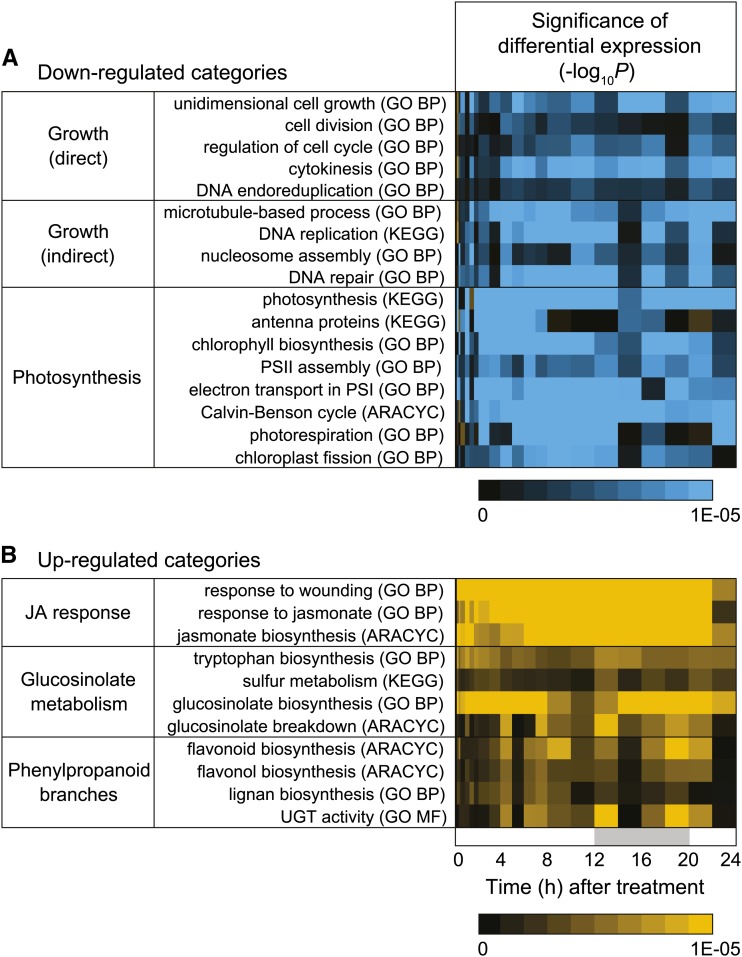
Figure 2.
Temporal dynamics of gene expression in response to COR treatment. Plants were treated with either COR or a mock control as described in the gene expression analysis section of Supplemental Figure S1. Heat maps depict functional categories of genes that were down-regulated (A; blue) or up-regulated (B; yellow) at the indicated times (h) after COR treatment. The significance of changes in transcript levels was determined at each time point by the Mann-Whitney-Wilcoxon test with Benjamini-Hochberg correction, with −log10-transformed P values displayed in the heat map. Functional categories from GO (BP, Biological Process; MF, Molecular Function), AraCyc, and KEGG were analyzed together using the AraPath annotation set. UGT, UDP-Glycosyltransferase.

