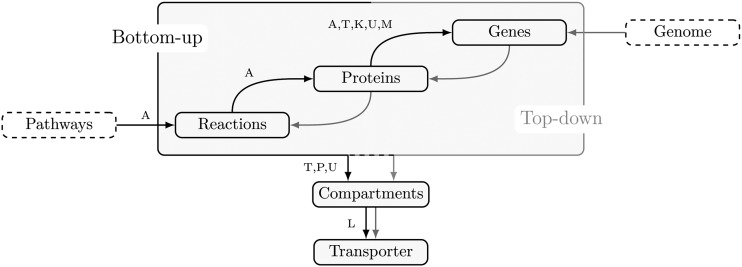
Figure 2.
Reconstruction workflow for the Arabidopsis core model. The arrow labels represent the databases used: A, AraCyc 11.5 (Mueller et al., 2003); T, The Arabidopsis Information Resource (Lamesch et al., 2012); K, Kyoto Encyclopedia of Genes and Genomes (Kanehisa and Goto, 2000); U, UniProt (UniProt Consortium, 2013); M, MapMan (Thimm et al., 2004); P, Plant Proteome Database (Sun et al., 2009); and L, literature. Black arrows refer to the workflow of the bottom-up approach, while gray arrows denote the steps of the top-down approach.

