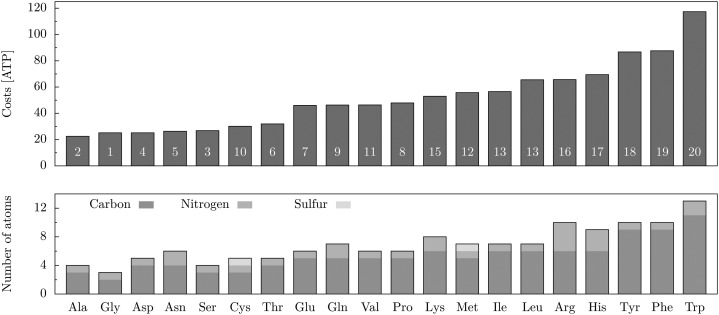
Figure 4.
Amino acid costs based on the Arabidopsis core model under optimal growth conditions. The white numbers on the bars denote the average ranking over the amino acid cost estimation of Craig and Weber (1998), Akashi and Gojobori (2002), Seligmann (2003), Wagner (2005), Barton et al. (2010), Sajitz-Hermstein and Nikoloski (2010), and the Arabidopsis core model (Supplemental Data S1, Table S11). For comparison, the amino acid composition with respect to the size of the carbon skeleton and the number of incorporated amine groups and sulfur is given in the bar plot at bottom.

