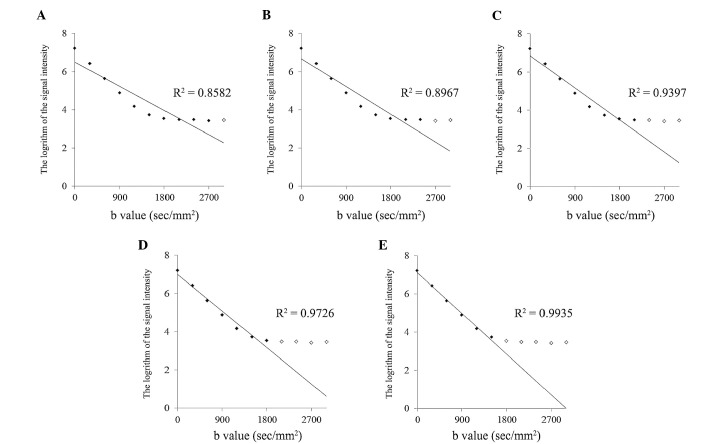
Figure 2.
Calculation of apparent diffusion coefficient values of a 0.2 M phantom at 37.09°C. The vertical axis indicates the logarithm of the signal intensity of the regions of interest in the diffusion-weighted image of the phantom. The horizontal axis indicates b values. ‘♦’ represents the data that were used for the least-squares method to obtain the regression line and the R2 value. ‘⋄’ represents the data that were not used for the least-squares method to obtain the regression line and the R2 value.

